US
US IN
INBy Dr. Neha Verma, Research Scientist – NGS, MedGenome Inc., USA
Spatial transcriptomics is a revolutionary molecular profiling method that allows scientists to measure in a tissue sample and map the activity to specific cell types and their location. This novel technology is paving the path to new discoveries that are proving instrumental in helping researchers gain a better understanding of biological processes and diseases leading it to be called the Method of the Year in 2020.
The beginnings of spatial transcriptomics can be traced back to the 1960s where nucleic acids were stained at their original locations with cells or tissues. Although the term spatial transcriptomics was first coined in 2016, the first steps were already taken in the late ’60s with the use of in situ hybridization. This was followed in the late ’90s by the first microdissection techniques, in which a microscope is used to dissect a small portion of tissue. The term “Spatial Transcriptomics” is a variation of Spatial Genomics, first described by Doyle, et. al., in 2000 and was then modified by Ståhl et. al. in 2016.
Single cell/nuclei sequencing plays a crucial role in identification of cellular subpopulations and their response to various conditions/stimuli. Cells are impacted by their native environment and surroundings. Understanding cellular responses in their endogenous spatial context. With spatial transcriptomics, it is now possible to obtain information on the transcriptomes of a single cell or a small group of cells, while maintaining the information on where the cell (or group of cells) is located within the tissue.
Currently, there are only a few different types of spatial transcriptomics techniques that are available. These include GeoMx from NanoString; Slide-seq, Apex-seq; High-Definition Spatial Transcriptomics (HDST); and 10X Genomics’ Visium Spatial Gene Expression.
GeoMx
NanoString’s GeoMx Digital Spatial Profiler allows to define a microscopic region of interest on an FFPE or frozen tissue slide due to a UV-photocleavable barcode engineered into the in-situ hybridization probes. The region of interest is specifically exposed to UV light, and the barcodes are cleaved, used to identify the RNA or protein present in the tissue. The size of the defined regions of interest can vary in between ten to six hundred micrometers allowing targeting of a wide variety of structures and cells in the histological sample.
APEX-seq
The method utilizes the APEX2 gene, expressed in live cells which are incubated with biotin-phenol and hydrogen peroxide. In these conditions, the APEX2 enzymes catalyse the transfer of biotin groups to the RNA molecules, and these can then be purified via streptavidin bead purification. The purified transcripts are then sequenced to determine which molecules were near the biotin tagging enzyme.
Slide-seq
Slide-seq relies on the attachment of RNA binding, DNA-barcoded micro beads to a rubber-coated glass coverslip. The microbeads are mapped to their spatial location via SOLiD sequencing. Tissue sections are transferred to this coverslip to capture extracted RNA. Captured RNA is amplified and sequenced. Transcript localization is determined by the barcode oligonucleotide sequence from the bead that captured it.
High-Definition Spatial Transcriptomics (HDST)
It is based on decoding the location of mRNA capture beads in wells on a glass slide. This is accomplished by sequential hybridization to the barcode oligonucleotide sequence of each bead. Once the location of each bead is decoded, a tissue sample can be placed on the slide and permeabilized. The captured transcripts are then sequenced. HDST uses smaller beads than Slide-seq and thus can resolve at a spatial resolution of two micrometers compared to ten micrometers of Slide-seq.
And the very latest breakthrough by 10X Genomics, Visium Assay. The Visium spatial assay combines traditional histopathology with unbiased, high-throughput gene expression analysis from the same tissue section at high resolution and sensitivity. This enables spatial clustering of cells based on gene expression that reliably correlates with the neuroanatomy of intact tissue, across different mammalian brain regions. The addition of immunofluorescence staining enables the simultaneous examination of protein and gene expression from the same tissue, providing additional insights.
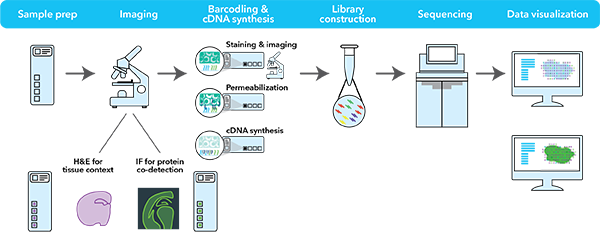
Source: 10X Genomics
The 10X Visium assay is a newer and improved version of the Spatial Transcriptomics assay which also utilizes spotted arrays of mRNA-capturing probes on the surface of glass slides but with increased spot number, minimized spot size and increased amount of capture probes per spot. Within each of the four capture areas of the Visium Spatial Gene Expression slides, there are approximately 5000 barcoded spots, which in turn contain millions of spatially barcoded capture oligonucleotides. Tissue mRNA is released upon permeabilization and binds to the barcoded oligos, enabling capture of gene expression information. Each barcoded spot is 55 µm in diameter, and the distance from the center of one spot to the center of another is approximately 100 µm. The spots are staggered to minimize the distance between them. On average, mRNA from anywhere between 1 and 10 cells are captured per spot which provides near single-cell resolution. Each Visium Spatial Gene Expression Slide includes 4 capture areas (6.5 x 6.5 mm), each defined by a fiducial frame (fiducial frame + capture area is 8 x 8 mm). The capture area has ~5,000 gene expression spots, each spot is ~55 microns with primers that include:
Illumina TruSeq Read 1 (partial read 1 sequencing primer). 16 nt Spatial Barcode (all primers in a specific spot share the same Spatial Barcode); 12 nt unique molecular identifier (UMI); 30 nt poly(dT) sequence (captures poly-adenylated mRNA for cDNA synthesis). Distance from center to center of each spot is ~100 microns.
Tissue sections on the capture areas of the Visium Spatial Gene Expression Slide are fixed using methanol. Hematoxylin is used to stain the nuclei, followed by eosin staining for the extracellular matrix and cytoplasm. The stained tissue sections are imaged. The same tissue section is permeabilized to release mRNA onto capture spots that contain spatially barcoded oligos fixed to the slide. mRNAs are converted to cDNAs and then collected for dual-indexed Illumina library construction and sequencing. The H&E stained image and the spatially barcoded cDNAs are overlaid to allow visualization of the gene expression within the original tissue placement.
The tissue sections should be no larger than the capture area (6.5 mm x 6.5 mm) to avoid covering the fiducial frame that is used to align the RNASeq data with the stained tissue images. In addition, tissue placed outside the capture area will also simply not generate any additional gene expression data, or could possibly convolute the gene expression data generated.
With Visium’s whole transcriptome and protein co-detection approach
- Gain insights on cell-to-cell interactions with spatial context: Discover new biomarkers by examining histology, protein, and mRNA from the same fresh frozen tissue section
- Characterize cellular sub-types and functional states: Reveal the spatial organization of newly discovered cell types, states, and biomarkers with whole transcriptome analysis
- Discover regional cell heterogeneity throughout: Examine gene and protein expression heterogeneity and how it contributes to biological system
Spatially resolved gene expression can provide a powerful complement to traditional histopathology methods, enabling a greater understanding of cellular heterogeneity and organization within the tissue architecture.
References
- Rao A, et al. Exploring tissue architecture using spatial transcriptomics. Nature. 2021 Aug; 596(7871): 211–220.
- Application Note: Enriching pathological analysis of FFPE tumor samples with spatial transcriptomics. LIT000152 – Rev A, https://pages.10xgenomics.com/rs/446-PBO-704/images/LIT000152_ApplicationNote_Visium_FFPE_Prostate_Cancer.pdf
- Ståhl PL, et al. Visualization and analysis of gene expression in tissue sections by spatial transcriptomics. Science 353: 78–82, 2016. doi: 10.1126/science.aaf2403
#Spatial Transcriptomics, #Spatial gene expression, #Spatial Genomics, #Transcriptomes, #Cellular heterogeneity