By Michelle Vierra Balakrishnan
Spatial analysis has become an indispensable tool in unraveling the complexities of biological systems. From understanding gene function to dissecting tissue microenvironments, spatial data holds the key to unlocking valuable insights into biological processes. However, harnessing the full potential of spatial data requires not only sophisticated analytical techniques but also considerable computational resources and expertise.
Standard spatial analysis
At the heart of spatial analysis lies the extraction of meaningful information from spatially resolved transcriptomic data. However, the output of a spatial experimental run is a FASTQ file from a sequencer that has to be further analyzed for useful information. Space Ranger, the go-to solution for standard spatial analysis of 10x Genomics spatial data, provides researchers with essential statistics and visualizations to assess data quality and explore gene expression patterns.
Space Ranger’s standard analysis pipeline generates key metrics such as the number of spots, genes per spot, and gene expression overlaid on slide images.
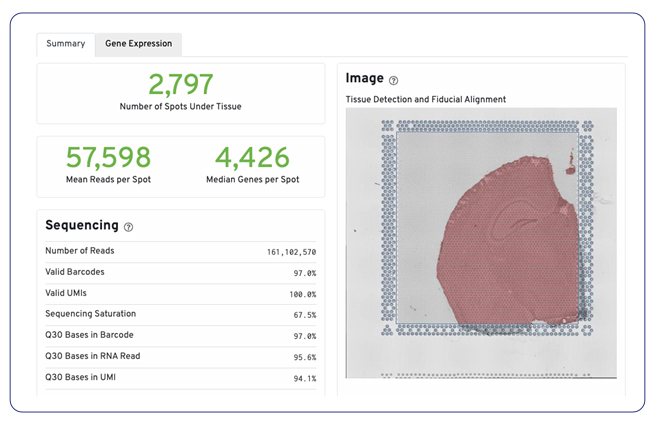
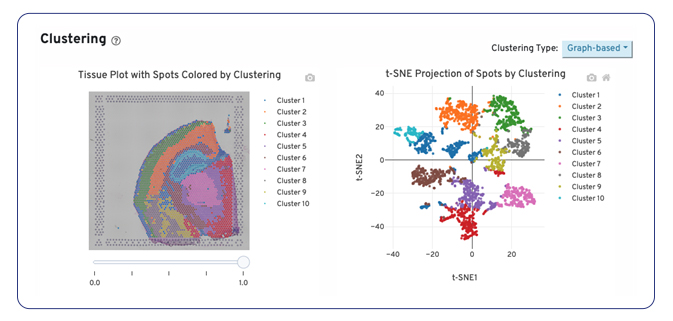
While Space Ranger is a free tool, it does require expertise for installation and execution as well as significant computational resources to perform the analysis. For researchers who want to save the time and computational resources required, MedGenome offers this standard analysis as a nominal add on to your spatial project.
Advanced spatial analysis: getting multidimensional insights and publication-ready images for your tissue sections
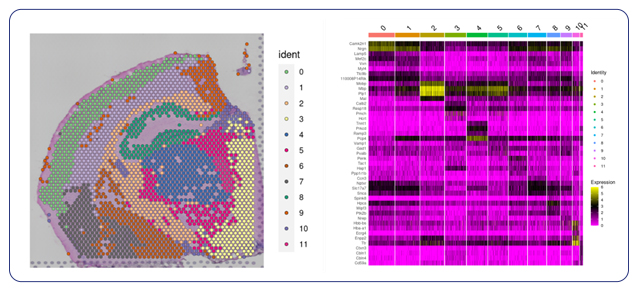
To truly get valuable insights from spatial data, you need additional QC and biological context. MedGenome’s advanced spatial analysis solutions go beyond standard readouts, incorporating rigorous filtering criteria to ensure your data is high-quality and reliable. We first identify and filter out low-quality spots and contaminants such as mitochondrial and ribosomal RNA, providing a clean dataset.

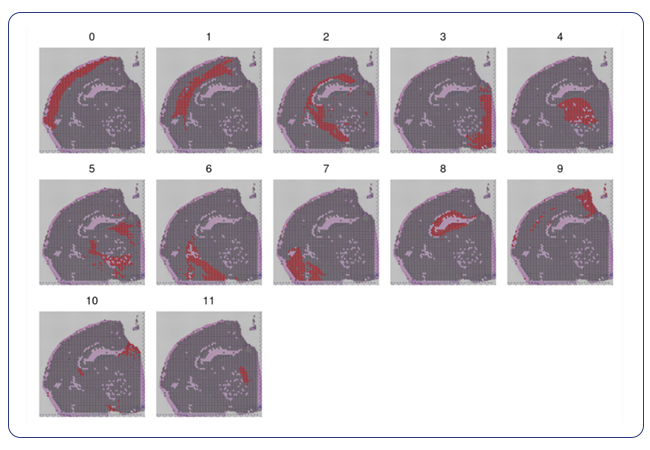
Following spot filtering, we use principal component analysis (PCA) and reclustering to provide a more accurate representation of the spatial transcriptome. We then provide visualizations as spatial plots by cluster to look at spatial localization of the spots. These plots, along with a heatmap and table of differential gene expression, furnish our clients with deeper insights into spatial gene expression patterns, paving the way for novel biological discoveries.
Specialized analysis: cell type annotation that fulfills your specific custom needs and interactome data for unique research questions
For researchers seeking specialized insights, MedGenome offers tailored analysis solutions designed to address specific research questions. Cell type annotation, a cornerstone of understanding the basis of tissue organization, is seamlessly integrated into MedGenome’s repertoire of analysis solutions. Leveraging public datasets, we can annotate the cell types in your data based on the tissue you are exploring. With this analysis, we provide spatial plots by cell type and provide additional plots for the confidence of cell annotation assignments.
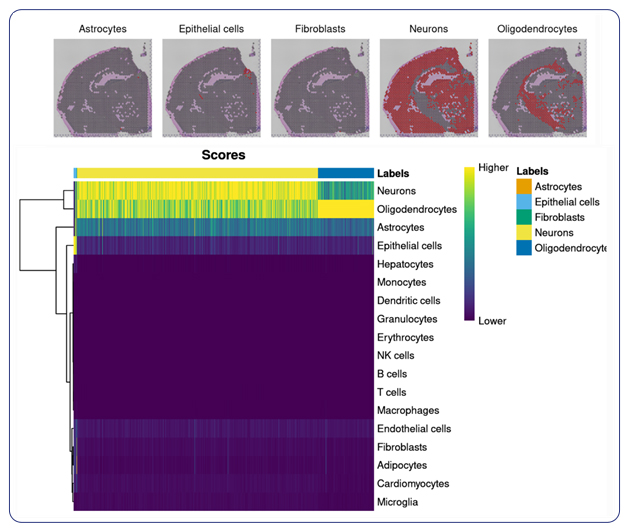
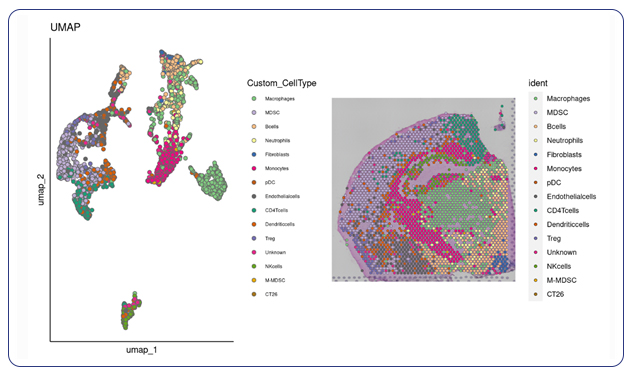
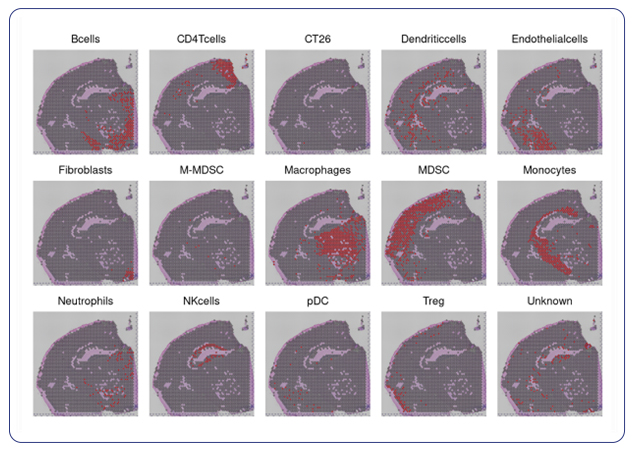
For researchers that have specific markers in mind for their cell types, we can take client-provided markers and annotate the specific cell types you’re interested in within your spatial data. With custom marker cell annotation we provide spatial plots by cell type and a table of differential gene expression.
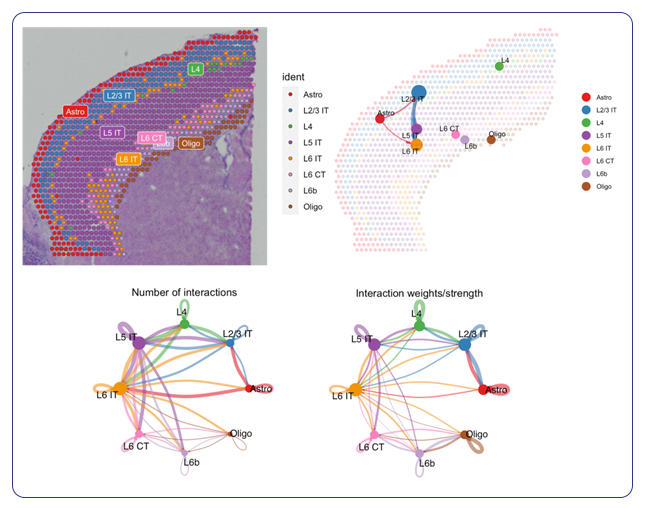
In addition to cell type annotation, MedGenome’s specialized analysis extends to pathway analysis and visualization of cell-to-cell interactions. Cell-to-cell communication models the probability of cell-to-cell communication by integrating gene expression with prior knowledge of the interactions between signaling ligands, receptors and their cofactors.
As part of the analysis, we provide a visualization of the interactome plotted on a spatial image showing not only the number of interactions between cell types, but also the weighted strength of those interactions. By elucidating molecular pathways and mapping intercellular communication networks, MedGenome equips researchers with a comprehensive understanding of tissue biology at the spatial level.
From strategy to publication: crafting spatial insights with your research in mind
Spatial data analysis holds immense promise for advancing our understanding of complex biological systems. However, navigating the intricacies of spatial data analysis requires more than just off-the-shelf tools—it demands specialized expertise and tailored solutions. MedGenome’s comprehensive suite of spatial analysis services, ranging from standard analysis to specialized annotation and pathway analysis, offers researchers a streamlined pathway to unlocking the rich biological insights hidden within spatial data.
Ready to apply spatial transcriptomics to your research questions? Get in touch with a MedGenome expert to scope out your project.
#spatial analysis, #spatial transcriptomics, #cell type annotation, #t-SNE, #transcriptomic data
 US
US IN
IN

