By Savita Jayaram Ph. D., Sheethal Umesh Nagalakshmi, Anay Limaye, Kushal Suryamohan Ph. D. , MedGenome Scientific Affairs
Emerging single-cell technologies have provided us with a powerful tool to dissect the clonal complexity of tumor cells, deconvolute the role of immune cell types in disease mechanisms, and monitor risk and treatment strategies to guide early patient diagnosis, since being highlighted as the ‘method of the year’ in 2013. As our capabilities in single cell sequencing continue to increase, latest advances in multi-omics of single cells are providing newer ways of integrating single cell transcriptomics with the multiple molecular measurements in a single experiment.
MedGenome provides novel assay and bioinformatics services to analyze multimodal single-cell datasets such as: CITEseq that simultaneously interrogates RNA and surface protein expression in single cells via the sequencing of antibody-derived tags (ADTs) and ATACseq that leverages transcriptome changes alongside chromatin accessibility and nucleosome occupancy. Concurrent estimation of both protein and transcript levels opens opportunities to use CITE-Seq in various biological areas, for instance, to profile disease heterogeneity, identifying rare cell sub-populations and novel subtypes, and to explore the mechanisms of host-pathogen interactions. ATACseq assays, on the other hand, can be applied to investigate chromatin accessibility signatures in diseases like macular degeneration and in human cancers, mapping transcription factor binding sites, exploring disease-relevant gene regulation, and studying evolutionary divergence of enhancer regions during development. Additionally, single-cell data can be used to reconstruct lineage trajectory maps, that can enhance our understanding of cell-fate transitions and identify putative branch points. Spatial transcriptomics provide users with extra insights into the cellular biology by providing a three-dimensional spatial context at single-cell resolution, and can be applied to both FFPE and frozen tissue sections. We have handled several such ‘multiome’ projects that have required customization/optimization of the lab protocols which helped us better understand the various QC checkpoints from both a wet lab and an analysis perspective. We have streamlined appropriate protocols, and built robust analysis pipelines, incorporating the latest tools and workflows.
Multimodal Analysis Workflow:
Although, single-cell transcriptomics has transformed our ability to characterize cell states, deep biological understanding requires advanced workflows such as the one depicted in the schematic below. A key analytical challenge is to integrate these multiple modalities to better understand cellular identity and function.1 Single-cell analysis tools need to accommodate different levels of resolution and throughput of the different datatypes, to comprehensively analyze the single cells at molecular level.

Single Cell CITEseq Analysis:
CITE-Seq (Cellular Indexing of Transcriptomes and Epitopes by Sequencing) is a multimodal single cell phenotyping method for performing RNA sequencing along with gaining quantitative and qualitative information on surface proteins with available antibodies on a single cell level.2 CITE-seq uses DNA-barcoded antibodies to convert detection of proteins into a quantitative and ‘sequenceable’ readout. Antibody-bound oligos act as synthetic transcripts that are captured during most large-scale oligodT-based scRNA-seq library preparation protocols (for e. g. 10x Genomics, Drop-seq, ddSeq). This allows for immunophenotyping of cells with a potentially limitless number of markers and unbiased transcriptome analysis using existing single-cell sequencing approaches. For phenotyping, this method has been shown to be as accurate as flow cytometry which is considered as the gold standard for absolute quantitative measurements. It is currently one of the main methods, to evaluate both gene expression and protein levels simultaneously in different species. Recently, this method has been successfully applied to understand the ongoing immune response in COVID-19 patients with varying severity, revealing discrete cellular compartments that can be targeted for therapy.3 The single-cell readout of both protein and transcript data at the same time can uncover novel information on protein-RNA correlations enabling precision health assessments. The increased copy number of protein molecules compared to RNA molecules typically leads to more robust detection of protein features. The protein data in CITE-seq may therefore represent the most informative modality.2 For data analysis, we leverage the weighted nearest neighbor (WNN) analysis provided by Satija lab in Seurat R package, which is an unsupervised strategy that defines the cellular state based on a weighted combination of both modalities.2 We find the WNN algorithm successfully recapitulates the biological expectations in comparison to separate analysis of each modality where certain cell populations can be masked allowing one datatype to compensate for weaknesses in another, demonstrating the importance of joint analysis. Additionally, this methodology enables interpretation of sources of heterogeneity from single-cell transcriptomic measurements, and integration of diverse types of single-cell data.
Single Cell Multiome (ATACseq) Analysis:
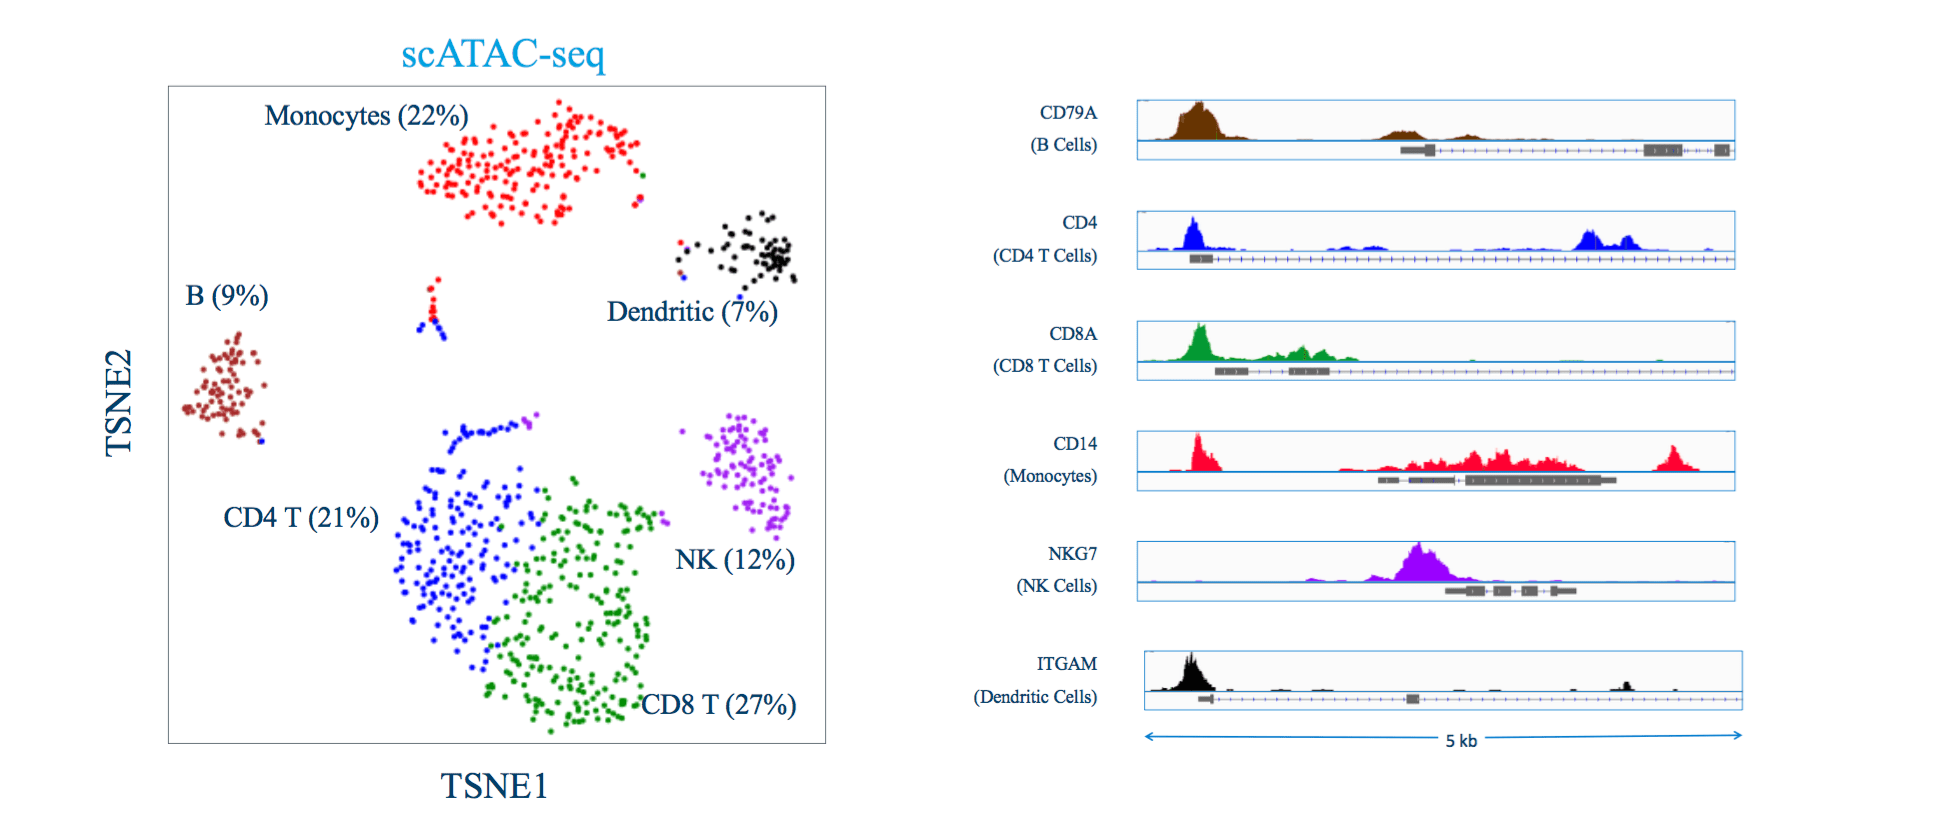
ATAC-seq aims at identifying DNA sequences located in open chromatin, i.e., genomic regions whose chromatin is not densely packaged and that can be more easily accessed by proteins than closed chromatin.4 The ATAC-seq technique makes use of an optimized hyperactive Tn5 transposase that fragments and tags the genome with sequencing adapters in regions of open chromatin. The output of the experiment is millions of DNA fragments that can be sequenced and mapped to the genome of origin for identification of regions where sequencing reads concentrate and form “peaks”. The hyperactivity of the Tn5 transposase makes the ATACseq protocol a simple, time-efficient method that requires 500–50,000 cells. The major steps in ATAC-seq data analysis include (1) Quality control and alignment, (2) Peak calling, (3) Advanced analysis at the level of peaks, motifs, nucleosomes, and TF footprints, and (4) Integration with multiomics data to reconstruct regulatory networks.4 ScATAC-seq can be applied in multiple situations including clinical specimens and developmental biology to study the heterogenous cell populations at single-cell resolution. However, this analysis is particularly challenging, due to both the sparsity of genomic data collected at single-cell resolution, and the lack of interpretable gene markers in scRNA-seq data. Similar to CITEseq, WNN analysis of Seurat can be applied to ATACseq data and it shows an increased ability to resolve cell states through integrated multimodal clustering. Further, ATACseq data analysis uses the Signac package developed by Satija lab, for the analysis of chromatin datasets. The cells are annotated using ScSorter, proven to have a higher annotation efficiency even for marker genes expressed at low levels.

Trajectory (Lineage) Analysis:
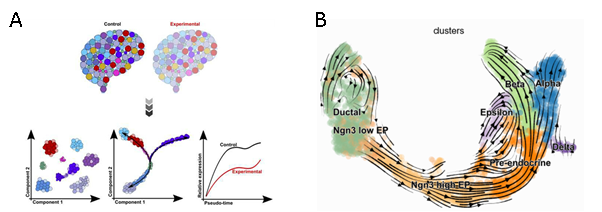
Trajectory inference has greatly boosted single-cell RNA-seq research by enabling the study of active and longitudinal changes vital to the discovery of genes governing lineages in the trajectory, or differentially expressed between groups. The wealth of information in the transcriptome of thousands of single cells can provide a snapshot of the dynamic changes at different levels of transition that is used to infer complex trajectories. The Monocle3 R package uses the concept of pseudotime, to order cells along a lineage based on the distance along a trajectory from its root or progenitor cells. For instance, in case of blood cell lineages, hematopoietic stem cells can be selected as the root cells. Monocle3 tracks these gene expression changes as a function of pseudotime, allowing for cells to have a branched structure when there are multiple possible outcomes. It can accurately resolve complicated biological processes and heterogenous cell populations, by learning an explicit principal graph based on advanced machine learning techniques called “Reversed Graph Embedding” followed by clustering.5 Subsequently, one can identify genes that are differentially expressed between different states such as control and experiment, or along the trajectories as cells transition from one state to another during development, disease or cell differentiation. Alternately, the velocity graph depicted in Figure B, describes cellular trajectories using RNA velocity (Velocyto or scVelo) that don’t rely on root cells but model the transitions based abundance of transcribed pre‐mRNAs (unspliced) to mature mRNAs (spliced).6 This can be easily identified in standard single‐cell RNA‐seq protocols due to the presence of introns, using Velocyto or loompy/kallisto counting pipeline.

Spatial Transcriptomics:
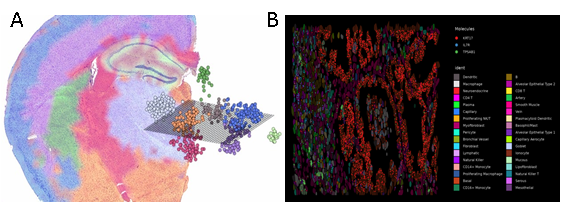
Recent developments have sparked a growing interest in spatial transcriptomics technology coming from various platforms, such as, the Visium system from 10X Genomics utilizes spotted arrays of mRNA-capturing probes or SLIDEseq, a method developed at Harvard, for transferring RNA from tissue sections onto a surface covered in DNA-barcoded beads, with known positions. Nature Methods had crowned spatially resolved transcriptomics as the Method of the Year 2020.8 This method leverages spatial gene expression to identify genes and delineate neighbourhoods within fresh frozen or FFPE tissue sections. Using this approach, we can detect RNA species enriched in different subcellular compartments, observe distinct cell states corresponding to different cell-cycle phases, and reveal relationships between spatial position and molecular state. Each of these datasets represents an opportunity to understand principles governing the spatial localization of different genes in different cell types while capturing cellular boundaries (segmentations). Some of these methods use targeted panels i.e., they profile a pre-selected set of genes. Newer adaptations of Single-molecule FISH (smFISH) called as multiplexed error-robust FISH (MERFISH) can achieve near-genome-wide RNA profiling of spatially resolved individual cells with high accuracy and detection efficiency. The Seurat vignette for spatial data analysis uses SCTransform-based normalization, followed by dimensionality reduction and clustering like other multi-modal datasets. However, in addition to UMAP embedding, it overlays the clusters on the images of the tissue sections providing a spatial visualization. It offers additional features to zoom in and visualize individual molecules at a higher resolution. Once zoomed-in, one can also visualize individual cell boundaries as well in all visualizations.

References
- 1. Stuart, T. et al. Comprehensive Integration of Single-Cell Data. Cell 177, 1888-1902.e21 (2019).
- 2. Hao, Y. et al. Integrated analysis of multimodal single-cell data. Cell 184, 3573-3587.e29 (2021).
- 3. Cambridge Institute of Therapeutic Immunology and Infectious Disease-National Institute of Health Research (CITIID-NIHR) COVID-19 BioResource Collaboration et al. Single-cell multi-omics analysis of the immune response in COVID-19. Nat. Med. 27, 904–916 (2021).
- 4. Yan, F., Powell, D. R., Curtis, D. J. & Wong, N. C. From reads to insight: a hitchhiker’s guide to ATAC-seq data analysis. Genome Biol. 21, 22 (2020).
- 5. Qiu, X. et al. Reversed graph embedding resolves complex single-cell trajectories. Nat. Methods 14, 979–982 (2017).
- 6. Bergen, V., Soldatov, R. A., Kharchenko, P. V. & Theis, F. J. RNA velocity—current challenges and future perspectives. Mol. Syst. Biol. 17, e10282 (2021).
- 7. Kulkarni, A., Anderson, A. G., Merullo, D. P. & Konopka, G. Beyond bulk: A review of single cell transcriptomics methodologies and applications. Curr. Opin. Biotechnol. 58, 129–136 (2019).
- 8. Marx, V. Method of the Year: spatially resolved transcriptomics. Nat. Methods 18, 9–14 (2021).
#single-cell technologies, #ATACseq, #CITEseq, #ATACseq, #scRNA-seq, #Single Cell Multiome, #10x Genomics, #scRNA-seq library preparation, #multimodal single-cell datasets, #clonal complexity
 US
US IN
IN

