From Sequences to Solutions: Exploring Colorectal Cancer Research & Treatment

Colorectal cancer (CRC) stands as the third most prevalent cancer and the second leading cause of cancer-related deaths in the US. It is projected that in 2024, there will be around 106,590 new cases of colon cancer and 46,220 new cases of rectal cancer. CRC incidence is notably higher among African Americans and lowest in Asian Americans/Pacific Islanders.

By MedGenome Scientific Affairs

Introduction

Colorectal cancer (CRC) stands as the third most prevalent cancer and the second leading cause of cancer-related deaths in the US. It is projected that in 2024, there will be around 106,590 new cases of colon cancer and 46,220 new cases of rectal cancer. CRC incidence is notably higher among African Americans and lowest in Asian Americans/Pacific Islanders. The five-year relative survival rate for localized CRC is estimated to be 91%, contrasting with a 14% rate for metastatic disease. Mortality rates among older adults have seen a decline in recent years owing to factors such as the implementation of screening programs, advancements in imaging technology for precise staging, improvements in surgical procedures, and the development of new treatment modalities. Nevertheless, concerning trends reveal a 1% annual increase in CRC mortality rates among individuals under 55 since the mid-2000s1,2.

Risk factors

Risk factors for CRC include genetic predisposition, environmental factors, and lifestyle behaviors such as obesity, smoking, and unhealthy diet. Long-standing ulcerative colitis and Crohn’s disease increase CRC risk. Other factors include family history of cancer, colon polyps, diabetes mellitus, and cholecystectomy. Additionally, gut microbiome composition, age, gender, race, and socioeconomic status influence CRC risk2.

Molecular pathways associated with CRC carcinogenesis

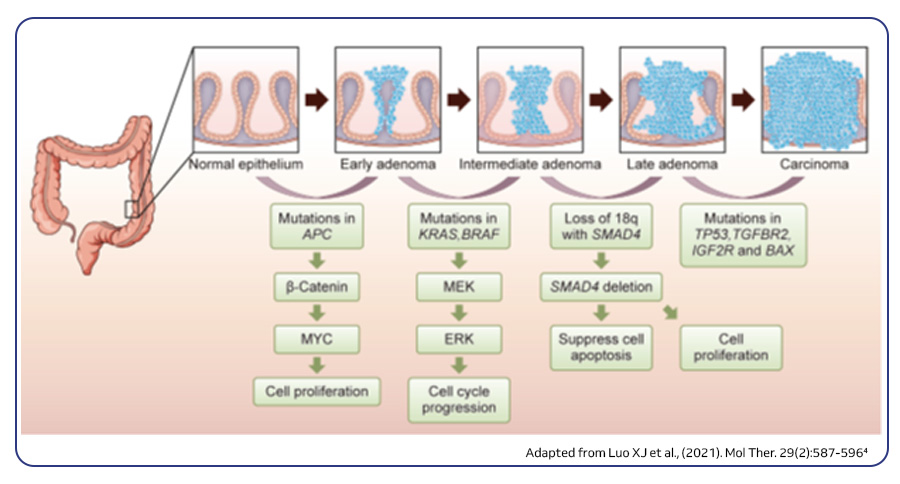
Approximately 75–80% of CRCs are sporadic, originating from the accumulation of genetic and epigenetic alterations within specific molecular pathways. These pathways play a crucial role in regulating cell growth, differentiation, and survival. This intricate process of carcinogenesis, known as the adenoma–carcinoma sequence, entails mutations in at least 15 cancer-related genes. From a molecular point of view, CRC is highly heterogeneous and this can be ascribed to three major molecular pathways. The most prevalent pathway, accounting for 85% of sporadic CRCs, is chromosomal instability (CIN). CIN is a hallmark of genomic instability and is characterized by gain and loss of large chromosomal segments, leading to gene copy number variations, frequent loss of heterozygosity (LOH) at specific gene loci and chromosomal rearrangements. These alterations often involve mutations in specific oncogenes such as BRAF, KRAS, PIK3CA or tumor suppressor genes such as APC, SMAD4 and p53, which regulate cell proliferation and play crucial roles in CRC initiation and progression pathways. The second pathway is the CpG island methylator phenotype (CIMP), evident in 15% of CRC cases. This pathway is characterized by the hypermethylation of CpG islands in their promoter regions resulting in the epigenetic silencing of the adjacent genes. The third one is microsatellite instability (MSI), accounting for about ~13–16% of sporadic cases and is often associated with hereditary forms of the disease, such as Lynch syndrome. This pathway results from defects in the DNA mismatch repair (MMR) genes responsible for correcting errors during DNA replication3,4.
Schematic illustration of the progression model of CRC
Figure 1: Schematic illustration of the progression model of CRC

Colorectal cancer: from genomic profiling to precision medicine

Genomic insights

Next-generation sequencing (NGS) technologies have revolutionized the understanding of CRC by facilitating comprehensive genomic profiling of tumors. In the past decade, extensive sequencing investigations have explored the genetic foundations of CRC, revealing significant pathways involved in its development, such as WNT, RAS-MAPK, PI3K, TGF-β, P53, and DNA mismatch repair pathways. NGS technology, utilized by global consortia like The Cancer Genome Atlas (TCGA) Research Network, adopted a comprehensive approach, examining exome sequences and DNA copy numbers, clarifying epigenetic modifications, and delineating the role of microRNA in human cancers, including CRC. These studies provided fundamental genetic insights and identified numerous new theranostic and prognostic molecular biomarkers, prompting further investigation and integration into clinical trials. These findings highlighted the genetic diversity of colorectal cancer, challenging its prior classification as a histopathologically homogeneous disease5.

Recently, single-cell RNA sequencing has effectively enhanced current molecular classifications of CRC by identifying unique sub-clones within previously identified subtypes through bulk transcriptomics, providing potential prognostic insights. Moreover, single-cell multi-omics approaches have been employed to monitor transcriptomic and epigenomic alterations in CRC, as well as to identify clinically relevant cell sub-clones linked to cancer progression and metastasis5.

Immunotherapy for metastatic CRC

Immunotherapy, particularly immune checkpoint inhibitors, has emerged as a promising treatment modality in CRC. Currently, immunotherapy in CRC treatment is primarily used for patients with metastatic disease and whose tumors are mismatch repair deficient (dMMR) or microsatellite instability-high (MSI-H). These tumors accumulate a higher number of mutations, making them more easily recognized and targeted by the immune system. Genomic research is focused on identifying biomarkers, such as tumor mutational burden (TMB) and immune-related gene expression profiles, that can predict response to immunotherapy. Additionally, researchers are investigating strategies to enhance the efficacy of immunotherapy in CRC, including combination approaches with other targeted therapies or chemotherapy.

Role of precision medicine

The concept of precision medicine, which involves tailoring treatment strategies to individual patients based on their unique genetic makeup and tumor characteristics, is gaining traction in CRC research. Although targeted therapies have improved outcomes for some patients, predictive models incorporating genetic and environmental factors for risk assessment and personalized screening are emerging but need validation across various populations. Precision medicine approaches aim to maximize treatment efficacy while minimizing adverse effects.

Liquid biopsies, a minimally invasive approach

Liquid biopsy techniques, such as circulating tumor DNA (ctDNA) analysis and circulating tumor cell (CTC) enumeration, are being increasingly utilized in CRC research and clinical practice. Liquid biopsies offer a minimally invasive method for monitoring disease progression, detecting minimal residual disease, and identifying treatment-resistant mutations. In addition to plasma cfDNA levels, which have conventionally been associated with tumor burden, sequencing cfDNA has demonstrated the ability to recapitulate the mutational profile of the primary tumor. They have the potential to revolutionize cancer diagnosis, monitoring, and treatment response assessment.

Characterization of tumor microenvironment

The tumor microenvironment (TME) plays a crucial role in CRC progression and response to therapy. Genomic research is investigating the complex interactions between tumor cells, immune cells, stromal cells, and the extracellular matrix within the TME, including the gut microbiota. Understanding these interactions may lead to the development of novel therapeutic approaches targeting the TME, such as immune-modulating agents and stromal-targeting therapies.

Table. 1. List of targeted therapy drugs used for CRC2
Molecular target Targeted therapy Mechanism of action
VEGF Bevacizumab, Ramucirumab, Ziv-aflibercept and Fruquintinib Inhibits angiogenesis mediated through VEGF pathway
EGFR Cetuximab and Panitumumab Binds to external domain of EGFR receptor and prevents its activation
BRAF Encorafenib Targets key enzymes in the MAPK signaling pathway
HER2 Trastuzumab, Pertuzumab and Lapatinib Binds to extracellular domain of HER2 (Trastuzumab), inhibits the heterodimerization of HER2 (Pertuzumab) and disrupts the downstream signaling pathways activated by HER2 (Lapatinib)
NTRK Larotrectinib and Entrectinib Inhibits the tropomyosin-related kinase (TRK) receptor domains found in TRKA, TRKB, and TRKC proteins, resulting in reduced cellular proliferation
RET Selpercatinib Inhibits RET kinase through ATP competitive mechanism
KRAS Adagrasib and Sotorasib Binds to and stabilizes RAS in its GDP-bound state, leading to decreased signal transduction, particularly through the RAF-MEK-ERK/MAP pathway
Immune checkpoint inhibitors
MSI or Deficient MMR Pembrolizumab, Nivolumab and Dostarlimb Binds to PD-1, a receptor expressed on activated T cells, inhibiting its activation by ligands resulting in the activation of T-cell-mediated immune responses against tumor cells
MSI or Deficient MMR Ipilimumab Inhibits CTLA-4 leading to T cell activation


Conclusions

A concerted global research endeavor is currently underway to advance treatments for colorectal cancer. This research encompasses a broad range of activities, from fundamental investigations aimed at unraveling the biological intricacies of CRC to inquiries into the societal factors influencing cancer risk. By adopting a multifaceted approach, we aspire to a future where CRC is not only prevented and detected at its earliest stages but also treated with personalized, efficient, and accessible strategies, ultimately enhancing the quality of life for patients worldwide.


MedGenome offerings

At MedGenome, we provide advanced NGS solutions with optimized workflows and protocols. As a 10x certified service provider, we also offer state-of-the-art single-cell sequencing solutions. Our robust in-house bioinformatics platform is tailored to transform raw data into actionable insights, delivering publication-ready, high-quality figures, and detailed reports across a range of NGS data types.

Please reach out to us at research@medgenome.com to get in touch with our expert scientific team for any queries and additional details.

To know more about our unique cancer genomics solutions and services please click on the following links: Whole genome and whole exome sequencing, RNA Sequencing, Single cell sequencing, Immune profiling and Epigenetic profiling


References

    • https://www.aacr.org/patients-caregivers/cancer/colorectal-cancer/
    • https://www.cancer.org/cancer/types/colon-rectal-cancer/about.html
    • Huang Z and Yang M. (2022). Molecular Network of Colorectal Cancer and Current Therapeutic Options. Front Oncol. 12:852927.
    • Luo XJ, Zhao Q, Liu J, Zheng JB, Qiu MZ, Ju HQ and Xu RH. (2021). Novel Genetic and Epigenetic Biomarkers of Prognostic and Predictive Significance in Stage II/III Colorectal Cancer. Mol Ther. 29(2):587-596.
    • Kyrochristos ID, Ziogas DE, Goussia A, Glantzounis GK and Roukos DH (2019). Bulk and Single-Cell Next-Generation Sequencing: Individualizing Treatment for Colorectal Cancer. Cancers (Basel). 11(11):1809.


#Colorectal cancer, #Next generation sequencing, #Genomic instability, #Genomic profiling, #Exome sequencing, #Single cell sequencing, #10x Chromium, #Targeted therapy, #Precision medicine, #Immunotherapy, #Immune checkpoint inhibitors, #Tumor microenvironment

 

Empowering Prevention: Genomic Insights for National Cancer Prevention Month

National Cancer Prevention Month is observed in the month of February every year, with an objective to raise awareness and promote initiatives to prevent cancer. Cancer ranks as the second leading cause of death in the United States (US). Despite government-led cancer education initiatives, the battle against this disease remains complex, with variations in cancer risk persisting among different ethnic groups due to genetic predispositions and disparities in healthcare access.

By MedGenome Scientific Affairs

National Cancer Prevention Month is observed in the month of February every year, with an objective to raise awareness and promote initiatives to prevent cancer. Cancer ranks as the second leading cause of death in the United States (US). Despite government-led cancer education initiatives, the battle against this disease remains complex, with variations in cancer risk persisting among different ethnic groups due to genetic predispositions and disparities in healthcare access. The incidence of different cancer types varies among population groups, influencing cancer rates within diverse demographics, often associated with genetic factors.

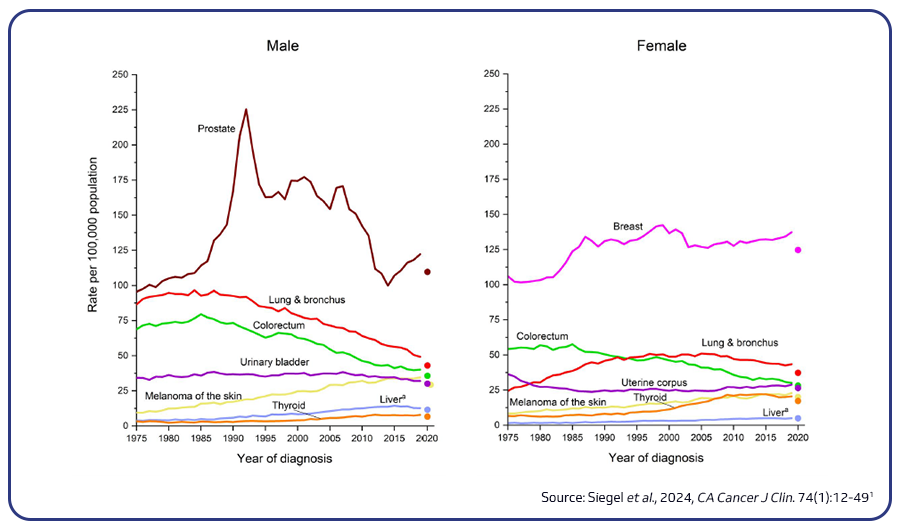
Figure 1: Incidence rate for selected cancer types in the US for the period between 1975-2020
Incidence rate for selected cancer types in the US for the period between 1975-2020

Table 1: Cancer type and rates by ethnic groups2,3

Ethnic group Cancer incidence rate
Hispanic/Latino and Black/African American women Higher incidence rate of cervical cancer
American Indians/Alaska Natives Higher death rate by kidney cancer
American Indians/Alaska Natives Highest rates of liver and intrahepatic bile duct cancer
African-American Males Highest incidence rate of lung and prostate cancer
White, non-Hispanic Highest incidence rate of breast cancer
Ashkenazi Jewish Women Higher risk of breast cancer

Cancer prevention and screening

Studies have indicated that nearly 50% of cancer deaths could be prevented through healthier lifestyles and addressing key risk factors. Some of these risk factors include tobacco use, alcohol intake, poor diet, lack of physical activity, obesity, infections with cancer-related pathogens (such as Human Papilloma Virus (HPV) and Hepatitis B Virus (HBV)), and exposure to ultraviolet radiation. In the US, about four out of ten new cancer cases are linked to preventable causes.

The primary objective of cancer screening is to detect cancer at an early stage or even before symptoms develop, aiming to improve treatment outcomes and reduce mortality rates. The United States Preventive Services Task Force (USPSTF) has provided evidence-based recommendations for conducting screening tests for individuals at average or higher-than-average risk of developing cancer. These recommendations are formulated after carefully evaluating the advantages and potential drawbacks of different strategies for disease prevention, such as cancer screening tests, genetic testing, and preventive treatments.

Some of the screening tests recommended include digital mammography and digital breast tomosynthesis for breast cancer, pap smear and HPV test for cervical cancer, stool-based tests and direct visualization tests (such as flexible sigmoidoscopy, colonoscopy, or computer tomography colonography) for colorectal cancer, low-dose spiral CT scan for lung cancer, and prostate-specific antigen (PSA) test for prostate cancer.

Understanding the healthcare implications of cancer genomics

Cancer genomics stands at the forefront of medical research due to its ability to provide unique insights into the genetic makeup of cancerous cells and tumors. This in-depth understanding facilitates various advancements in cancer diagnosis, treatment, and prevention:

  • Variant detections: Genetic variants and mutations within cells are the primary cause of cancer or tumor development. Identification of such novel variants can aid in monitoring tumor progression and develop treatment strategies tailored to individual needs. These variants encompass a range of alterations, including single nucleotide substitutions, insertions, deletions, copy number alterations, and other structural rearrangements.
  • Biomarker discovery: Genomic techniques help to identify various cancer-causing molecular indicators. It allows to understand the various gene expression patterns implicated in cancer thus guiding clinical decision-making, predicting patient outcomes, and monitoring treatment effectiveness.
    Eg: BRCA1 and BRCA2 mutations in breast cancer, EGFR Mutations in Non-small cell lung cancer, KRAS Mutations in colorectal cancer, BRAF V600E mutation in melanoma, Microsatellite Instability (MSI) in Lynch syndrome, and PD-L1 expression in immunotherapy.
  • Personalized medicine: Genomics assists in pinpointing specific population cohorts susceptible to cancer types and can even furnish a comprehensive genomic portrait of individuals, expediting treatment and facilitating the delivery of effective therapies for favorable results. Some of the common cancers where precision medicine can be very useful are colorectal cancer, breast cancer, lung cancer, leukemia, lymphoma, melanoma, esophageal cancer, stomach cancer, ovarian cancer and thyroid cancer5.
  • Targeted therapies: Cancer genomics aids in zeroing in on those genetic mutations within individual tumors and the pathways that propel cancer progression, thereby identifying precise therapeutic targets for effective treatments. Examples of targeted therapies include: Selective BRAF inhibitor vemurafenib for BRAF mutant melanoma, Imatinib and nilotinib targeting the BCR-ABL protein, Erlotinib targeting epidermal growth factor receptor (EGFR), Trastuzumab targeting HER2 cell signaling protein, lapatinib for breast cancer, crizotinib for lung cancer, bevacizumab for lung and colon cancer; and sorafenib for liver and kidney cancer etc6.
  • Immunotherapy: Analyzing the genomic profiles of cancer and immune cells sheds light on their diverse interactions within the tumor microenvironment. This insight aids in understanding how cancer cells evade immune detection and informs the development of targeted immunotherapies. Neoantigens, identified through prediction algorithms, are emerging as crucial players in cancer immunotherapy. They are unique molecules found on the surface of cancer cells due to tumor mutations. Neoantigens activate the immune system, enabling it to selectively attack cancer cells. Harnessing this knowledge is critical in designing effective cancer immunotherapies, such as immune checkpoint inhibitors and cancer vaccines.

Table 2: List of different types of immunotherapy along with examples

Type of Immunotherapy Example
Immune Checkpoint Inhibitors (ICIs) Pembrolizumab (Keytruda), Nivolumab (Opdivo), Ipilimumab (Yervoy)
Chimeric Antigen Receptor (CAR) T-cell Therapy Tisagenlecleucel (Kymriah), Axicabtagene ciloleucel (Yescarta)
Cytokine Therapy Interferon-alpha, Interleukin-2
Cancer Vaccines Sipuleucel-T (Provenge), HPV vaccines (Gardasil, Cervarix)
Monoclonal Antibodies Rituximab (Rituxan), Trastuzumab (Herceptin)
Oncolytic Virus Therapy Talimogene laherparepvec (T-VEC or Imlygic)

Next generation sequencing and cancer genomics

Next-generation sequencing (NGS) has transformed cancer detection and treatment by offering extensive genomic profiles across diverse cancer types. This innovative technology allows for the sequencing of entire genomes, exomes, transcriptomes, or specific genes, thereby facilitating a deeper understanding of cancer genomics. Furthermore, NGS offers several advantages, including the ability to tailor treatment plans to individuals, predict disease outcomes, and identify individuals at higher risk.

Conclusions

Exploring cancer genomics deepens our understanding of the molecular underpinnings of cancer, including its origins, progression, and resistance to therapy. This insight propels continuous investigation into the intricate facets of cancer biology, driving the development of novel approaches for both preventing and treating the disease.

MedGenome offers a cutting-edge genomics-based approach to analyze the tumor microenvironment with unique insights beyond IHC and FACS methods. OncoPeptTUMETM deeply interrogates RNA-Sequencing data sets to produce high resolution mapping of the tumor microenvironment using proprietary cell type specific gene expression signatures. Also, we provide comprehensive genomic profiling of tumor samples using TruSight Oncology 500 (TSO-500) assay, with 523 cancer-related gene variants and 55 RNA variants, this panel provides extensive coverage of biomarkers frequently found in various cancer types. Additionally, our scientific team excels in addressing challenging sample processing scenarios and managing high-throughput sample workflows, ensuring accurate and efficient analysis of cancer genomic data.


References


#Cancer genomics, #Cancer Prevention, #Next-generation sequencing, #Whole genome, #Whole exome, #Whole transcriptome, #RNA Sequencing, #TSO-500, #TruSight Oncology, #Tumor microenvironment, #Gene expression, #Biomarker discovery, #Personalized medicine, #Targeted therapies, #Immunotherapy


From Single Cells to Spatial Landscapes: Unraveling Gene Expression with 10x Flex and Visium

Single-cell RNA sequencing (scRNA-seq) is a powerful method that is widely used in biomedical research. It is extensively used to determine cell composition of complex tissues, identify rare cell types, map heterogeneity at single cell level and identify paired, full-length immunoglobulin sequence and T-cell receptor α/β. Advancements in high-throughput single-cell RNA sequencing technologies, in combination with powerful computational tools, has made scRNA-seq a widely used technology

By MedGenome Scientific Affairs

Single-cell RNA sequencing (scRNA-seq) is a powerful method that is widely used in biomedical research. It is extensively used to determine cell composition of complex tissues, identify rare cell types, map heterogeneity at single cell level and identify paired, full-length immunoglobulin sequence and T-cell receptor α/β. Advancements in high-throughput single-cell RNA sequencing technologies, in combination with powerful computational tools, has made scRNA-seq a widely used technology across a broad spectrum of therapeutic areas such as oncology, immunology, neuroscience and developmental biology. Requirement of live cells for most single cell workflows is a bottleneck that limits its wider usage. Advent of 10x genomics Flex protocol has enabled single cell gene expression profiling using fixed samples including FFPE samples. This offers several advantages compared to conventional single cell workflows.

Advantages of using 10x Flex

The conventional methods for scRNA-seq primarily depend on freshly isolated, or cryopreserved cells, rendering them unsuitable for formaldehyde-fixed or FFPE samples. With 10x Genomics’s Chromium Single Cell Gene Expression Flex kit, it is now possible to fix, and store cells or nuclei at -80°C, allowing subsequent analysis without compromising the data quality. Once the fixed single-cell or nuclei samples are prepared for analysis, they undergo hybridization with probe sets designed to target specific regions in the transcriptome. These probe sets are barcoded, facilitating either individual processing in a singleplex or a multiplex workflow. The hybridized transcripts are then amplified to generate sequencing libraries using Gel Bead-in-emulsion (GEM) droplets and the Chromium system. Finally, the samples are sequenced and analyzed using Cell Ranger, a software suite designed specifically by 10x Genomics for performing single-cell RNA sequencing data analysis. An additional multiomic benefit of Flex is the ability to integrate gene expression data with the identification of cell surface proteins at the single-cell level, utilizing both singleplex and multiplex workflows.

A key feature of Flex is its ability to make scRNA-seq adaptable for fragile tissues, ensuring immediate preservation to minimize the loss of quality. Flex is extremely useful when dealing with infectious samples as the samples are fixed. Fixing the samples can neutralize the infectious agents, potentially allowing researchers to handle and analyze samples outside of Biosafety Level 3 facilities, depending on the specific agent, fixation method, and regulatory guidelines. Also, it offers a cost-effective price per cell and is well-suited for large-scale projects. Furthermore, the option for sample multiplexing contributes to decreased batch and experimental variability.

Workflow employed for the single cell gene expression analysis
Figure 1: Overview of the workflow employed for the single cell gene expression analysis of fixed cells using 10x Flex
Table illustrating the differences in capabilities between Flex and 3′ Gene Expression assays from 10x Genomics
Features Flex 3′ Gene expression
Type of chemistry Probe-based Reverse transcription-based
Sample type Primary cells,
dissociated fresh or fixed tissue,
including FFPE and cell lines
Primary cells, dissociated fresh tissue and cell lines
Cell throughput Singleplex: 10,000 cells/channel; up to 80,000 cells/chip
Multiplex: 128,000 cells/channel; up to 1,024,000 cells/chip
Low: 1,000 cells per channel, with a maximum of 8,000 cells/chip
Standard: 10,000 cells per channel, with a maximum capacity of 80,000 cells/chip.
High: 20,000 cells per channel, with a total of 320,000 cells/chip.
Species compatibility Human and Mouse Human, mouse, rat, model organisms, and plants
Number of reads per cell Between 10,000 and 40,000 Between 30,000 and 80,000
Cell recovery High Variable
Sensitivity High Moderate

Exploring spatial gene expression using Visium from 10x Genomics

Spatial transcriptomics is another powerful technique for measuring gene expression across a tissue section, thus providing spatial context. Characterizing spatial distribution of different cell types in healthy and disease conditions can provide significant insights. It can also provide valuable insights into biomarker discoveries, and the elucidation of tumor heterogeneity and its dynamic microenvironments.

Since its inception, spatial transcriptomics has been widely used to study tissue architecture and associated expression pattern in various conditions. Spatial technologies can be broadly categorized into two groups: imaging-based and sequencing-based technologies. The major difference between these two approaches lies in how the spatial localization and abundance of mRNA molecules are determined within a tissue section.

Among several platforms available for spatial transcriptomics, Visium from 10x Genomics is one of the most widely methods. It is an in situ capturing method, wherein the transcript is captured within the tissue and subsequently sequenced externally. The Visium workflow consists of slides, imprinted with oligo capture barcoded probes. The tissue sections are placed onto a glass slide, stained, and then imaged. The tissue sections are then permeabilized, decrosslinked and incubated with transcript specific probes. Transcriptomic probes are then transferred to Visium slides that contain capture probes and extended with barcodes. These barcoded probes are then transferred to microfuge tubes to prepare 10x barcoded sequencing library. These libraries are then sequenced using standard short read sequencing technologies like Illumina.

The Visium technology is compatible with fresh frozen and FFPE tissues.

Workflow for whole FFPE tissue section analysis using Visium platform
Figure 2: Workflow for whole FFPE tissue section analysis using Visium platform

Both Flex and Visium are powerful tools for single-cell sequencing analysis, but they differ in their capabilities and workflow.

Applications of 10x Flex and Visium

    • Oncology: Characterize tumor heterogeneity and tumor microenvironments
    • Drug discovery and development: Understand how drugs affect cells at the single-cell level, identify potential drug targets, and predict therapeutic responses
    • Immunology: Decipher the immune response at single-cell level, investigate immune cell composition and dynamics within tissues, understand immune response mechanism to diseases or infections
    • Neuroscience: Analyze gene expression in specific brain regions to gain insights into neural circuits and brain function
    • Developmental Biology: Characterize diverse cell types within complex tissues, identify gene expression patterns crucial for tissue formation and determine the spatiotemporal dynamics

MedGenome sequencing and bioinformatics solutions

MedGenome is a 10x Genomics Certified Service Provider empowering researchers with cutting-edge single-cell sequencing solutions. Our comprehensive bioinformatics solutions enable researchers to interrogate single cell and spatial transcriptomics data to answer questions ranging from cellular heterogeneity to cell type composition to differential gene expression analysis and much more.

Bioinformatics analysis outputs
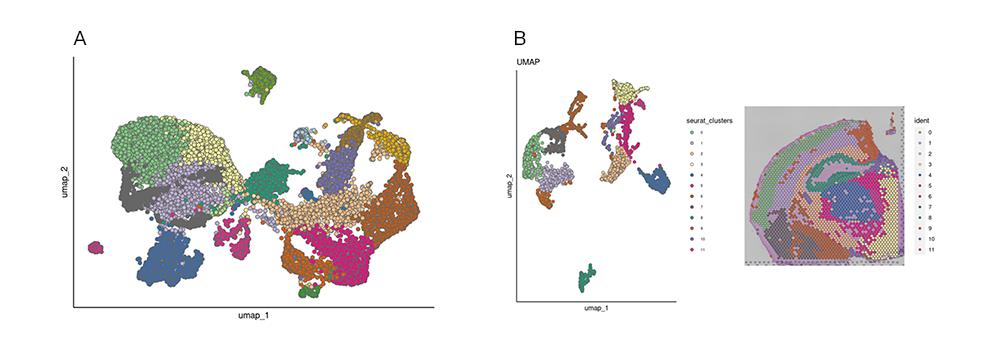
Figure 3 Bioinformatics analysis outputs. A. UMAP visualization of clustering of cells processed using 10x Flex. B. 10x Visium allows visualization of clustering of cells within your sample of interest and visualization of the spatial localization of cells colored by their cluster identity.

Explore MedGenome’s efficient and rapid 10x Flex and Visium solutions for a budget-friendly option. For detailed insights into our multi omics solutions, connect with the MedGenome scientific team at research@medgenome.com.


References


#Single cell gene expression, #Single cell RNA sequencing, #10x single cell FLEX kit, #Spatial transcriptomics, #Visium


Transcriptome sequencing to uncover gene expression signatures and disease biomarkers

Transcriptome sequencing/RNA sequencing allows unbiased characterization of global gene expression profiles associated with different cells/tissues. As genes govern cellular function, transcriptome profile can provide valuable insights into molecular mechanisms operating in a biospecimen. RNA sequencing has transformed biological research by discovering almost all transcripts encoded by a genome including mRNAs, long non-coding RNAs and miRNAs. It has also revealed many alternatively spliced variants which is a common feature among complex multicellular organisms.

By MedGenome Scientific Affairs

Overview of Transcriptomics

Transcriptome sequencing/RNA sequencing allows unbiased characterization of global gene expression profiles associated with different cells/tissues. As genes govern cellular function, transcriptome profile can provide valuable insights into molecular mechanisms operating in a biospecimen. RNA sequencing has transformed biological research by discovering almost all transcripts encoded by a genome including mRNAs, long non-coding RNAs and miRNAs. It has also revealed many alternatively spliced variants which is a common feature among complex multicellular organisms. It has revolutionized biomedical research by enabling characterization of global gene expression profiles associated with cells/tissues in healthy and disease conditions. Understanding molecular mechanisms of disease has paved way for identification of biomarkers and development of novel drugs targeting specific genes that drive disease pathology.

RNA sequencing has been widely used to study tumor microenvironment and the interactions between cancer cells and immune cells, providing insights into mechanisms of tumor immune evasion and potential targets for immunotherapy. In infectious disease research, RNA sequencing has been used to study host-pathogen interactions and identify host factors that contribute to disease susceptibility or resistance. By analyzing gene expression profiles of infected cells, researchers have uncovered molecular mechanisms underlying pathogen replication and host immune responses. This knowledge can aid in the development of new antiviral therapies and vaccines.

Applications of RNA Sequencing

    • Gene expression profiling of cells/tissues
    • Differential gene expression profiling to identify and quantify gene expression differences between healthy and disease tissues
    • Identification and characterization of alternatively spliced transcripts
    • Identification of biomarkers based on gene expression signatures associated with different diseases
    • Identification of drug targets based on molecular mechanisms that drive disease pathology
    • Identification of oncogenic fusion transcripts that drive cancers
    • Characterization of molecular mechanisms associated with host-pathogen interactions in infectious diseases
    • Characterization of gene expression at single cell resolution

MedGenome offers a variety of RNA sequencing services based on sample quality and amount of available starting material.

Types of RNA sequencing services offered by MedGenome

Library Prep Services Assay Type Stranded Type Starting Material Input Amount
TruSeq Stranded mRNA mRNA Seq Yes RNA 100 ng – 1 μg RNA
Illumina Stranded mRNA mRNA Seq Yes RNA 25 ng – 1 μg RNA
Takara SMART-Seq V4 mRNA Seq No RNA, Cells 10 pg – 10 ng RNA, 1 – 1,000 cells
TruSeq Stranded Total RNA Total RNA Yes RNA 100 ng – 1 μg RNA
Pico V2 / V3 Total RNA Yes RNA 250 pg – 10 ng RNA
SMART-Seq Stranded Total RNA Yes RNA, Cells 10 pg – 10 ng RNA, 1 – 1,000 cells

Single-Cell RNA Sequencing

Distinct gene expression profiles are associated with different cell types. Single-cell RNA sequencing has emerged as a powerful tool, allowing researchers to unravel the heterogeneity and complexity of biological systems. This technique enables the identification and characterization of rare cell populations, which are often missed in bulk RNA sequencing. By analyzing gene expression profiles at the single-cell level, researchers can identify cell types, define cell states, and uncover novel disease-associated biomarkers. The same technology is now widely used for characterizing immune repertoire by sequencing T-cell and B-cell receptors. It has also enabled identification of heavy and light chain pairs from B cells to characterize antigen specific antibodies.

The process of single-cell RNA sequencing involves multiple steps, including cell isolation, RNA extraction, library preparation, sequencing, and data analysis. Cells are typically dissociated from the tissue of interest and captured in microfluidic devices or droplet-based systems. Individual cells are then lysed, and RNA molecules are extracted and converted into complementary DNA (cDNA). The cDNA is amplified, and sequencing libraries are prepared for high-throughput sequencing.

Data analysis in single-cell RNA sequencing is a complex task due to the large number of cells and the high-dimensional nature of the data. Bioinformatic tools and algorithms are used to cluster cells based on their gene expression profiles, identify differentially expressed genes, and infer cellular trajectories. By integrating single-cell RNA sequencing data with other omics data, such as genomics and proteomics, researchers can gain a more comprehensive understanding of disease mechanisms. MedGenome uses 10x Genomics platform for offering single cell transcriptomics services.

Data Generation and Analysis

RNA sequencing generates vast amounts of data, which require sophisticated computational tools and algorithms for analysis. The raw sequencing data undergoes quality control to remove low-quality reads and sequencing artifacts. The processed reads are then aligned to a reference genome or transcriptome to determine the origin of each read.

Once the reads are aligned, the next step is to quantify gene expression levels. This involves counting the number of reads that map to each gene or transcript. Various statistical methods are used to normalize the expression data and identify differentially expressed genes between different conditions or cell types.

Data analysis in RNA sequencing also involves the identification of alternative splicing events, non-coding RNAs, and fusion genes. These events can provide valuable insights into disease mechanisms and potential therapeutic targets. Furthermore, RNA sequencing data can be integrated with other types of omics data, such as genomic and proteomic data, to unravel complex interactions and regulatory networks.

Looking Ahead: The Future of RNA Sequencing

The field of RNA sequencing is rapidly evolving, with new technologies and analytical approaches being developed. One of the major challenges in RNA sequencing is the analysis of low-quality or degraded RNA samples. Researchers are actively working on improving the sensitivity and accuracy of RNA sequencing methods to overcome this limitation.

Another area of active research is the integration of RNA sequencing data with other omics data, such as genomics, proteomics, and metabolomics. Integrative omics analysis can provide a more comprehensive understanding of disease mechanisms and identify novel therapeutic targets. Machine learning and artificial intelligence algorithms are being developed to analyze and interpret large-scale omics data, enabling the discovery of complex interactions.

In conclusion, RNA sequencing has revolutionized biomedical research by providing a comprehensive view of gene expression patterns and molecular signatures. It has enabled the identification of biomarkers for various diseases and has shed light on the underlying mechanisms of complex diseases. With continuous advancements in technology and data analysis, RNA sequencing holds great promise for personalized medicine and the development of targeted therapies.

MedGenome RNA Solutions or Case study

Papillary thyroid carcinoma (PTC) is one of the most common forms of thyroid cancer with >90% of cases achieving remission post-surgery. Despite this favorable outcome, the emergence of aggressive variants underscores the growing need for personalized therapeutic approaches.

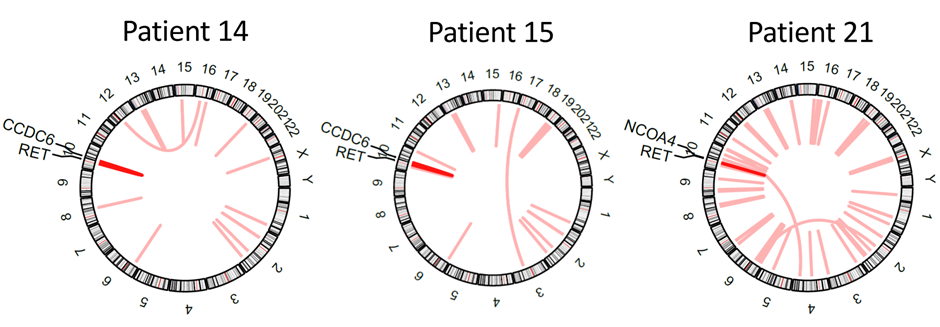
In collaboration with researchers at the University of Mainz, Germany, MedGenome generated RNA sequencing and proteomic data from PTC tumor samples from 22 patients1. Multiomic analysis identified a novel rearrangement in one of the patients. This novel rearrangement led to a BAIAP2L1-BRAF fusion gene product that transformed immortalized human thyroid cells. We also identified two previously known RET fusions in two other patients (Figure 1) as well as other druggable targets including TRIM25, PKCδ, and PDE5A.

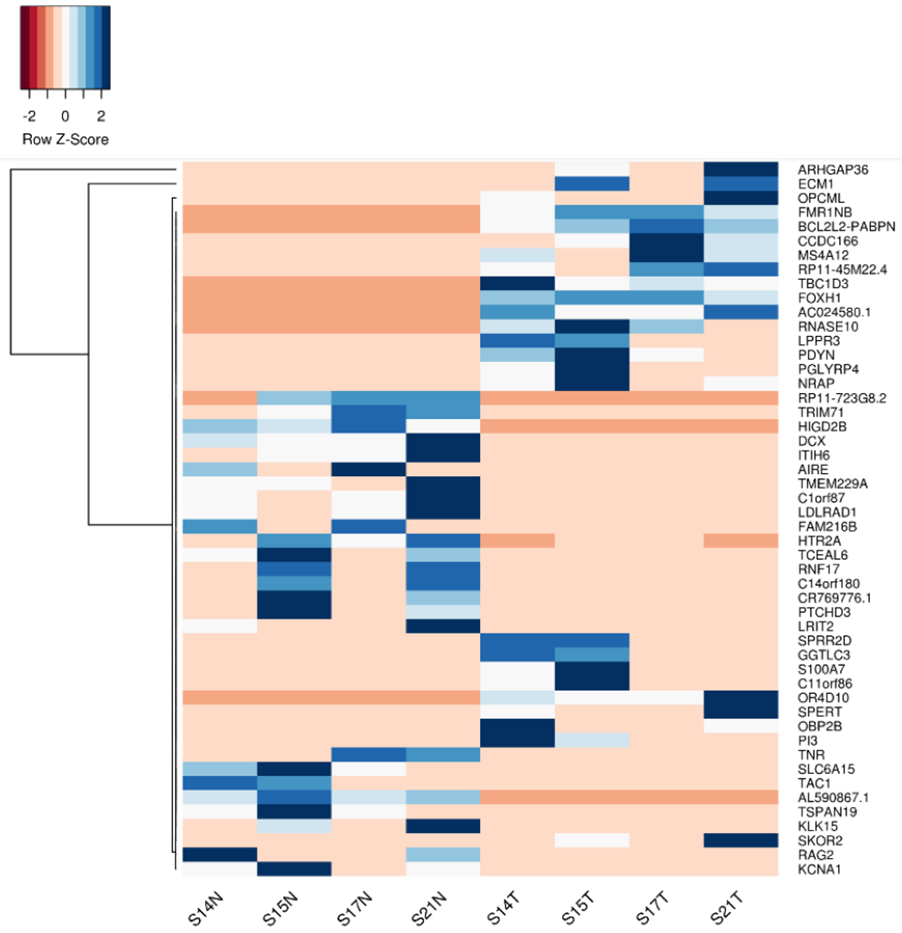
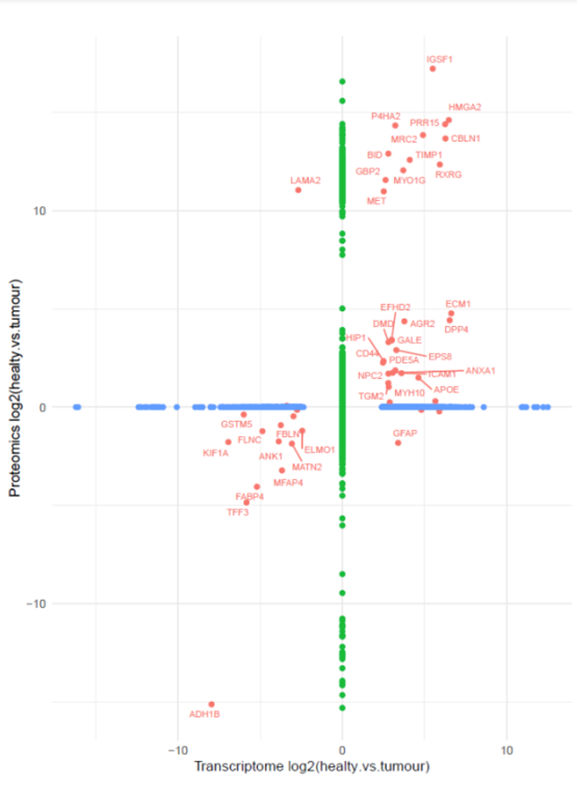
Integrative analysis of RNA-seq and proteomics data was performed using the list of differentially expressed genes (Figure 2) and proteins derived independently from RNA-seq and proteomics data, respectively in the fusion-carrying patients to identify factors significantly deregulated at both the mRNA and protein levels. This analysis yielded 20 identified factors (Figure 3), including PDE5A and IGSF1 (also called p120), a factor known to be associated with hypothyroidism, which are upregulated in tumor and/or metastatic tissue in comparison to the matching normal tissue.

Circos plots showing RET fusions
Figure 1: Circos plots showing RET fusions detected in patients 14, 15 and 21 from the study.
Heat map of RNA-seq analysis
Figure 2: Heat map of RNA-seq analysis of normal vs tumor tissue of the 4 patients carrying the fusion proteins (adjusted p-value < 0.05, log2 fold change ≠ 0).
Integrative analysis of proteomic and RNA-seq data
Figure 3: Integrative analysis of proteomic and RNA-seq data for identification of additional targetable factors. The scatter plot shows significantly differentially expressed targets detected only in RNA seq data (blue), proteomics data (green) or both (red).

Taken together, this study demonstrates the power of multiomic analyses to identify and characterize cancer therapy targets, which in turn can advance precision medicine and personalized therapeutics.

If you are interested in learning more about RNA sequencing and its applications in disease research connect with our scientific team by writing to us at research@medgenome.com


References

    • Renaud, E., Riegel, K., Romero, R. et al. Multiomic analysis of papillary thyroid cancers identifies BAIAP2L1-BRAF fusion and requirement of TRIM25, PDE5A and PKCδ for tumorigenesis. Mol Cancer 21, 195 (2022).

#Transcriptome sequencing, #RNA Sequencing, #Biomarker Identification, #Gene Expression, #Spliced transcripts, #Single cell resolution, #Single-cell RNA sequencing


Immune Repertoire Profiling: New Trends

The field of immune repertoire profiling has witnessed remarkable advancements in recent years, revolutionizing our understanding of the immune system and its role in various diseases. One of the key techniques to understand this complex mechanism is TCR sequencing. TCR, or T-cell receptor, plays a crucial role in the adaptive immune response by recognizing and binding to specific antigens.

By MedGenome Scientific Affairs

The field of immune repertoire profiling has witnessed remarkable advancements in recent years, revolutionizing our understanding of the immune system and its role in various diseases. One of the key techniques to understand this complex mechanism is TCR sequencing. TCR, or T-cell receptor, plays a crucial role in the adaptive immune response by recognizing and binding to specific antigens. By sequencing the TCR repertoire, researchers can gain valuable insights into the diversity and specificity of T-cell populations, leading to the development of novel treatment modalities in infectious diseases, autoimmunity, and immuno-oncology.

TCR sequencing has proven to be a powerful tool for understanding:

  • Host-pathogen interactions and designing effective therapeutic strategies: Through analysis and identification of specific T-cell clones associated with protective immune responses, novel vaccines or immunotherapies that target these specific T-cell clones can be developed.
  • TCR sequencing provides crucial insights into the underlying mechanisms of Auto-immune disease development: By comparing the TCR repertoires of patients with autoimmune disorders to those of healthy individuals, researchers have been able to identify aberrant T-cell populations that are associated with autoimmune pathology. This knowledge aids in the development of targeted therapies that restore immune balance and alleviate autoimmune symptoms.
  • TCR sequencing holds immense promise for personalized cancer treatment: By profiling the TCR repertoire of tumor-infiltrating lymphocytes (TILs), researchers can identify T-cell clones that are specifically targeting tumor antigens. This information can then be used to engineer T-cell-based immunotherapies, such as chimeric antigen receptor (CAR) T-cell therapy, that specifically target and eliminate cancer cells. TCR sequencing also allows for the monitoring of treatment response and the identification of potential immune escape mechanisms employed by tumors.

RNA based TCR repertoire profiling

While traditional TCR sequencing methods rely on genomic DNA, recent advancements in RNA-based sequencing techniques have expanded the scope of immune repertoire profiling. RNA-based TCR repertoire profiling offers several advantages over DNA-based methods, providing deeper insights into T-cell dynamics and functionality.

By profiling the TCR repertoire at the RNA level, researchers can capture the transcriptomic landscape of T-cells, allowing for the identification of actively expressed T-cell clones. This enables a more accurate representation of the T-cell diversity and functionality within a given sample. Moreover, RNA-based TCR sequencing facilitates the characterization of antigen-specific T-cells, enabling researchers to map the immune response to specific antigens with greater precision.

RNA-based TCR repertoire profiling also allows for the detection of alternative splicing events within the TCR transcripts. Alternative splicing can result in the generation of T-cell receptor isoforms with distinct antigen-binding properties. By capturing these isoforms, researchers can gain a deeper understanding of T-cell receptor diversity and its implications for immune recognition and response.

BCR repertoire profiling in diagnostic biomarker discovery and disease diagnosis

B-cells, through their B-cell receptors (BCRs), play a crucial role in humoral immunity by recognizing and binding to antigens. Profiling the BCR repertoire offers valuable insights into B-cell differentiation, BCR somatic hypermutation, class switching, and antigen specificity.

One of the key applications of BCR repertoire profiling is in diagnostic biomarker discovery. By analyzing the BCR repertoires of patients with certain diseases, researchers can identify disease-specific B-cell clones or antibody sequences. These disease-associated BCR sequences can then be utilized as diagnostic biomarkers, aiding in the early detection and monitoring of diseases. Furthermore, BCR repertoire profiling can also provide insights into disease progression and treatment response, enabling personalized medicine approaches.

BCR repertoire profiling provides a better picture for disease diagnosis. By comparing the BCR repertoires of healthy individuals to those of patients, researchers can identify disease-specific B-cell clones or antibody sequences. This information can aid in the early diagnosis and classification of diseases, facilitating timely interventions and improving patient outcomes.

Deeper insights into B-cell differentiation, BCR somatic hypermutation, class switching, and antigen specificity

Beyond its applications in biomarker discovery and disease diagnosis, BCR repertoire profiling provides deeper insights into various aspects of B-cell biology. By analyzing the BCR repertoires of different B-cell subsets, researchers can unravel the intricate processes of B-cell differentiation. This knowledge not only enhances our understanding of normal immune development but also sheds light on the dysregulation of B-cell differentiation in diseases such as leukemia and lymphoma.

BCR repertoire profiling is also instrumental in studying BCR somatic hypermutation and class switching. Somatic hypermutation is a key mechanism through which B-cells generate high-affinity antibodies, while class switching allows to produce different antibody isotypes with distinct effector functions. By analyzing the BCR repertoires of B-cell subsets at different stages of somatic hypermutation and class switching, researchers can decipher the underlying molecular mechanisms and regulatory networks governing these processes.

Furthermore, BCR repertoire profiling enables the characterization of antigen-specific B-cell populations. By identifying B-cell clones that are enriched for specific antigen-binding sequences, researchers can gain insights into the antigen-specific immune response. This information can be valuable for vaccine development, as it helps in the identification of immunogenic epitopes and the assessment of vaccine efficacy.

In conclusion, immune repertoire profiling, particularly through TCR and BCR sequencing, has revolutionized our understanding of the immune system and its role in various diseases. From infectious diseases to autoimmunity and immuno-oncology, TCR sequencing has paved the way for novel treatment modalities. RNA-based TCR repertoire profiling offers deeper insights into T-cell dynamics and functionality. On the other hand, BCR repertoire profiling provides valuable information about B-cell differentiation, somatic hypermutation, class switching, and antigen specificity. By harnessing the power of immune repertoire profiling, we are unlocking new frontiers in diagnostics, therapeutics, and our overall understanding of the immune system.

At MedGenome, we provide TCR and BCR repertoire profiling using bulk input (from cells, RNA) using the SMARTerTCR/BCR Profiling Kit (Takara Bio USA Inc) the Chromium Immune Profiling solutions (10X Genomics). We have expertise in processing a variety of sample types at high-throughput mode.

    • Complete workflow — Sample extraction, library prep, sequencing and for seamless data analysis and visualization
    • Increased accuracy — unique molecular identifier (UMI)-based PCR error correction
    • Detection of TCR clonotypes — Detection of novel clonotypes, and sensitive identification of full-length V(D)J and gives high resolution TCR-α and TCR-β pairing information.
    • Detection of all BCR isotypes — sequence all heavy and light chains seamlessly with pooled primers


References

Shugay M. et al. Towards error-free profiling of immune repertoires. Nat. Methods 11, 653–655 (2014).

Yaari, G. and Kleinstein, S.H. Practical guidelines for B-cell receptor repertoire sequencing analysis. Genome Med. 7:121 (2015).

Georgiou, G., Ippolito, G., Beausang, J. et al. The promise and challenge of high-throughput sequencing of the antibody repertoire. Nat Biotechnol 32, 158–168 (2014).

Six, A., et al. (2013) The past, present, and future of immune repertoire biology–the rise of next-generation repertoire analysis. Front. Immunol. 4(413):1–16.

#Immune repertoire profiling, #TCR repertoire profiling, #BCR repertoire profiling, #TCR sequencing, #TCR and BCR repertoire profiling, #B-cell differentiation


Next generation cytogenomics: Optical genome mapping (OGM) for detection of chromosome structure variations

Genetic variation can range from changes at the level of single bases to whole-chromosomal aneuploidies. Structural variations (SVs) refer to a large alterations in chromosomal structure, typically encompassing larger than 1 Kbp of DNA. SVs include both balanced changes, such as inversions and some forms of translocations, as well as those that alter DNA copy number through duplications and deletions of chromosomal segments.

By Dr. Anwesha Ghosh, PhD, Manager – Scientific Affairs and Communications Specialist

Genetic variation can range from changes at the level of single bases to whole-chromosomal aneuploidies. Structural variations (SVs) refer to a large alterations in chromosomal structure, typically encompassing larger than 1 Kbp of DNA. SVs include both balanced changes, such as inversions and some forms of translocations, as well as those that alter DNA copy number through duplications and deletions of chromosomal segments. SVs account for 25% of protein truncating mutations and are 3 times more likely to associate with a genome-wide association study (GWAS) signal than single nucleotide variants (SNVs). SVs contribute to all classes of genetic disease: sporadic development syndromes, Mendelian diseases, complex disorders and infectious diseases, as well as health-related metabolic phenotypes.

While next generation sequencing (NGS) has enabled extensive characterization of SNVs in the human genome, the short length of sequencing reads it employs impairs its ability to provide insight into larger genomic changes like SVs. Conventional methods to detect SVs include karyotyping, fluorescence in situ hybridization (FISH) and chromosomal microarray analysis (CMA). While karyotyping is cost effective, it suffers from numerous drawbacks, including low resolution, high labor and time consumption, requirement for cell culture, and subjectivity in interpretation. FISH, while not requiring cell culture and significantly improving resolution, is a targeted approach that cannot provide genome-wide information. While CMA can overcome these limitations, it cannot detect certain classes of SVs, such as balanced translocations or inversions, expansions of repeat regions, or low-level mosaicism.

Optical genome mapping (OGM) offers a solution to these pitfalls by essentially combining the genome-wide scope of karyotyping with the visualization principle of FISH into a single workflow that provides data at the highest resolution reported for the field of cytogenetics at 500 bp, while successfully detecting all classes of SVs. A comparison of the requirements, scope, and performance of karyotyping, FISH, CMA and OGM is provided in Table 1.

Table 1

OGM-table

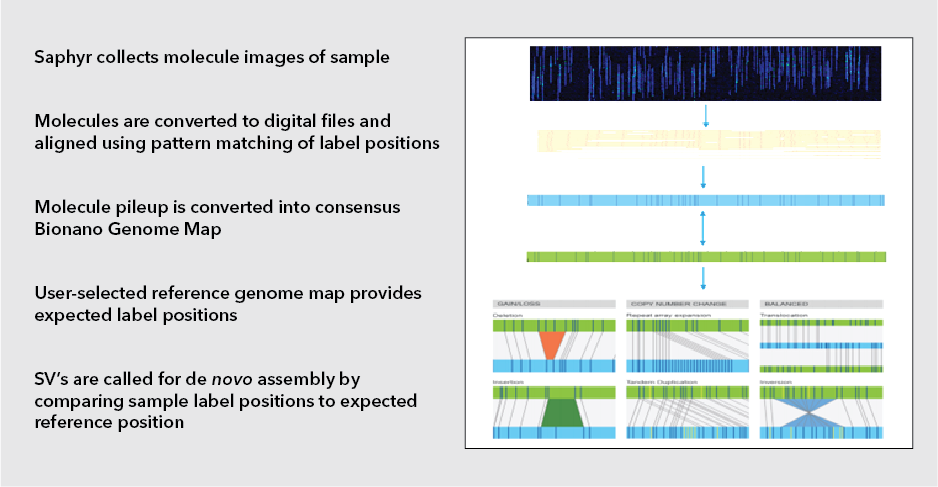
OGM relies on the isolation of intact, ultra-high molecular weight (UHMW) DNA using an extraction protocol specifically designed to minimize the shearing forces generated by typical standard column-based extraction methods. This yields DNA fragments of ~150 Kb to a few Mb in size. This DNA is then fluorescently labeled via covalent modification at CTTAAG hexamer motifs which occur throughout the genome at a frequency of ~14-17 per 100kb in sequence specific patterns. The labeled DNA is loaded on silicon microfluidic chips containing thousands of parallel nanochannels in which individual DNA molecules are linearized, imaged, and digitized. Each DNA fragment bears a distinct spacing and pattern of the hexamer labels (also known as the label profile), which are subsequently grouped and aligned based on label profile matching to produce consensus maps. These maps are then compared in silico to the expected labeling profile of a reference genome. DNA containing structural variations will display a labeling profile that differs from the reference genome at the location of the variation. The type of structural variation present can be determined based on the nature of the altered labeling profile (Fig 1). Bionano’s Saphyr system is currently the best in class for OGM.

Bionano workflow from DNA imaging to calling for SVs
Figure 1: Bionano workflow from DNA imaging to calling for SVs

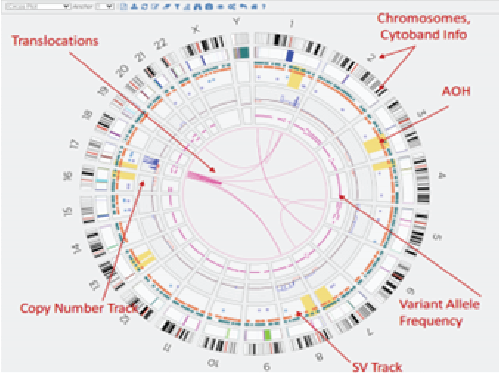
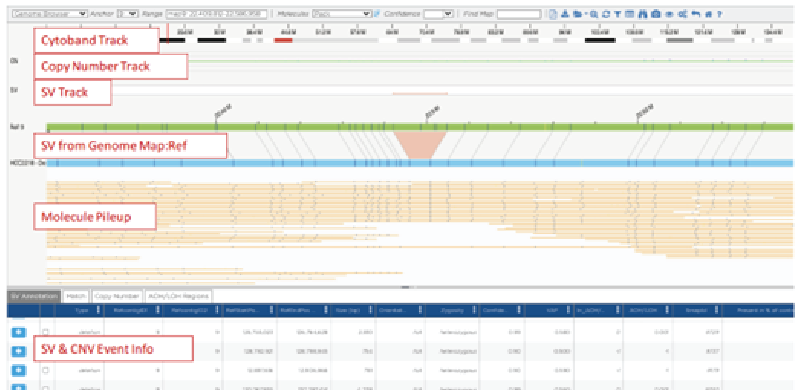
SV calling can be performed using Bionano pipelines such as annotated de novo assembly for somatic variations or the annotated rare variant pipeline for germline variations. A snapshot of all SVs detected in the genome in any given experiment can be viewed in a circos plot, while closer inspection of specific regions can be performed in the genome map view (Figure 2).

Bionano EnFocus pipelines have also been developed for targeted detection of specific genomic variations known to be found in diseases like facioscapulohumeral muscular dystrophy (FSDH) and Fragile X syndrome.

Circos Plot

genome-map-view

Genome Map View

genome-map-view
Figure 2: Circos plots and genome map views of data obtained by OGM

Currently, MedGenome offers Bionano’s EnFocus solution for detection of FSHD, which is the third most common inherited skeletal muscle disease. FSHD is associated with contraction of the D4Z4 microsatellite repeat regions within the sub-telomeric region of chromosome 4q35. Normal individuals harbor 11-100 such repeats, while afflicted individuals harbor less than 10 repeats. The current standard of care to confirm an FSHD diagnosis is mainly through a Southern blot assay. However, Southern blots are time and labor intensive with a greater scope for human error, which are drawbacks that can be overcome with the OGM approach.

OGM has applications in the fields of hematological malignancies, solid tumor research, constitutional genetic disorders and quality control for cell and gene therapy such as CAR-T immune cell therapy. As a precision medicine tool for hemato-oncology, it can identify classical actionable fusions (such as the BCR-ABL1 fusion in acute lymphoblastic leukemia) and could enable patient stratification based on signature SVs associated with biological phenomena underlying specific therapeutic sensitivities, such as high replication stress. It can easily identify multiple complex rearrangements within a single patient in challenging cases, thereby precluding the need to perform multiple conventional techniques. It can also identify novel variations, such as those that are missed by sequencing because they are too long or high in GC content. Additionally, it unlocks the potential to characterize SV landscape of solid tumors, which had remained largely unexplored due to the challenges of karyotyping. Finally, when combined with NGS, OGM can not only provide a more comprehensive understanding of cancers, but also aid the diagnosis of rare monogenic diseases.


#Optical genome mapping (OGM), #OGM, #Structural variations, #ultra-high molecular weight (UHMW) DNA, #Bionano’s Saphyr system, #Facioscapulohumeral muscular dystrophy (FSDH), #Fragile X syndrome


Advanced Bioinformatics Solutions for Single Cell Research

Bioinformatics plays a vital role in analyzing complex high-throughput sequencing data, particularly in the realm of single cell research. The ability to analyze and interpret massive amounts of single cell data has revolutionized our understanding of cellular heterogeneity and its implications in various biological processes. The blog explores the capabilities of bioinformatics team at MedGenome in analyzing single cell sequencing data. Here, we explore different types of bioinformatics reports, the importance of data visualization and generation of interactive reports such as differential gene expression analysis, heatmap visualization, interactive tSNE plots with cell type and cluster information.

By MedGenome Scientific affairs

Bioinformatics plays a vital role in analyzing complex high-throughput sequencing data, particularly in the realm of single cell research. The ability to analyze and interpret massive amounts of single cell data has revolutionized our understanding of cellular heterogeneity and its implications in various biological processes. The blog explores the capabilities of bioinformatics team at MedGenome in analyzing single cell sequencing data. Here, we explore different types of bioinformatics reports, the importance of data visualization and generation of interactive reports such as differential gene expression analysis, heatmap visualization, interactive tSNE plots with cell type and cluster information.

Types of Bioinformatics Reports

In the realm of single cell analysis, bioinformatics reports play a pivotal role in summarizing and presenting the findings derived from complex datasets. There are several types of bioinformatics reports commonly used in single cell research, each serving a unique purpose.

  1. 1. Cell Type Identification Report: Cell phenotype and its function is determined by gene expression repertoire. Single cell transcriptome profiling is best suited for determining cell type composition of different tissues and also to identify relative proportion of different cell types. This report focuses on the identification and categorization of different cell types within a given dataset. It utilizes unsupervised clustering algorithms to assign cells to distinct clusters based on their gene expression profiles. The report provides insights into the composition and heterogeneity of the sample.
  2. 2. Cell State Analysis Report: This report aims to uncover the different cellular states within a cell type. It utilizes dimensionality reduction techniques such as principal component analysis (PCA) or t-distributed stochastic neighbor embedding (tSNE) to visualize the variation in gene expression across cells. By identifying different cellular states, researchers can gain insights into cell fate determination, cell differentiation, and cellular plasticity.
  3. 3. Cell-Cell Interaction Analysis Report: This report focuses on deciphering the interactions between different cell types within a tissue or organism. It utilizes network analysis algorithms to infer the communication networks and regulatory relationships between cells. By understanding cell-cell interactions, researchers can unravel the mechanisms underlying tissue development, immune response, and disease progression.

Data Visualization and Interactive Reports

In the realm of single cell research, data visualization plays a pivotal role in unraveling the hidden patterns and structures within complex datasets. It allows for a comprehensive understanding of cellular heterogeneity and facilitates the interpretation of biological phenomena.

Data visualization tools in bioinformatics enable researchers to create interactive reports that provide a dynamic and intuitive representation of single cell data. These interactive reports allow users to explore the data at different levels of granularity, visualize gene expression patterns, perform differential gene expression analysis, and even interact with individual cells.

By leveraging advanced data visualization techniques, such as scatter plots, heatmaps, and bar plots, researchers can gain valuable insights into the relationships between cells, identify key genes or pathways associated with specific cell states or cell types, and even discover novel cellular subpopulations.

Differential Gene Expression and Heatmap Visualization

Differential gene expression analysis is a powerful bioinformatics technique used to identify differentially expressed genes between different groups of cells or conditions. It is particularly useful in single cell research, as it allows researchers to identify genes that play a crucial role in defining specific cell types or cellular states.

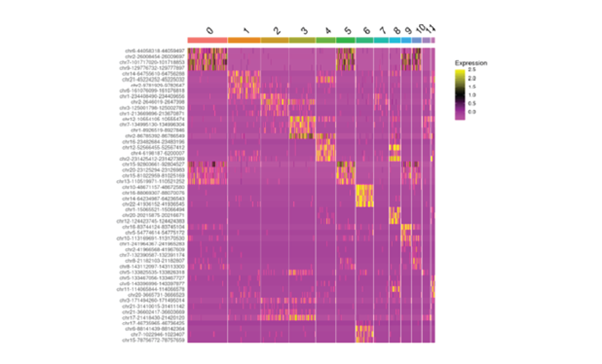
We provide various options to visualize the data. For example, the following heatmap provides a graphical representation of gene expression patterns across different cell types or conditions. By visualizing gene expression patterns in a heatmap, researchers can easily identify clusters of genes that are co-expressed and gain insights into the underlying regulatory networks.

Heatmap showing differential peak accessibility between clusters
Figure 1: Heatmap showing differential peak accessibility between clusters

Interactive tSNE Plots with Cell Type and Cluster Information

t-distributed stochastic neighbour embedding (tSNE) is a dimensionality reduction technique widely used in single cell analysis. It allows for the visualization of high-dimensional data in a two-dimensional space, while preserving the local structure of the original dataset.

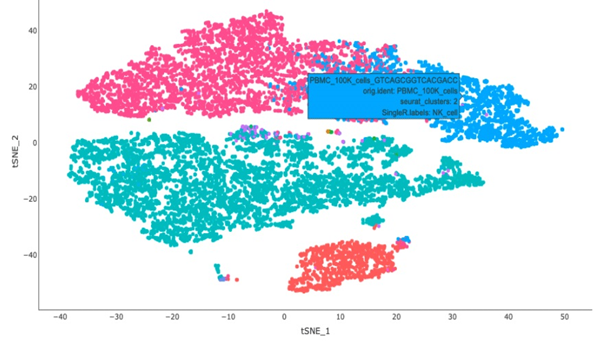
Interactive tSNE plots with cell type and cluster information provide an intuitive representation of cellular heterogeneity within a sample. By assigning different colors or shapes to different cell types or clusters, researchers can easily identify the distribution and composition of cell populations.

These interactive plots enable researchers to explore the data at different resolutions, zoom in on specific cell types or clusters of interest, and even interact with individual cells to extract additional information. They serve as a powerful tool for hypothesis generation, data exploration, and result validation in single cell research.

Interactive tSNE plots
Figure 2: Interactive tSNE plots with cell type & cluster information

Future of Bioinformatics in Single Cell Research

As single cell analysis continues to evolve, so does the field of bioinformatics. The future of bioinformatics in single cell research holds tremendous potential for further advancements and breakthroughs.

One of the key areas of development is the integration of multi-omics data in single cell analysis. By combining single cell RNA sequencing with other omics techniques such as proteomics, epigenomics, and metabolomics, researchers can gain a more comprehensive understanding of cellular heterogeneity and molecular mechanisms.

Moreover, the development of machine learning algorithms and artificial intelligence techniques will enhance the ability of bioinformatics tools to handle large-scale single cell datasets and extract meaningful information. These advanced algorithms will enable the identification of novel cell types, the prediction of cell fate trajectories, and the discovery of new therapeutic targets.

In conclusion, bioinformatics has become an indispensable tool in single cell research. It enables researchers to tackle the challenges posed by massive amounts of single cell data, extract meaningful insights, and unravel the complexities of cellular heterogeneity. With the continuous development of bioinformatics tools and techniques, the future of single cell analysis holds great promise for further advancements in our understanding of biology and disease.

MedGenome’s Specialized Bioinformatics Solutions involve:

  • • Single 3’ and 5’ Gene Expression
  • • Single Cell Multiome: ATAC + Gene Expression
  • • CITE-seq: Cell surface protein expression + Gene Expression
  • • Single cell immune profiling: VDJ expression for paired B-cell or T-cell receptors (possible coupling with GEX data)
  • • Visium spatial transcriptomics: GEX analysis on sectioned tissue layer

MedGenome’s advanced analysis pipeline provides researchers with a comprehensive report which includes publication ready tables, plots and detailed metrics to visualize and interpret the results.

To know more about our capabilities and solution offerings reach us at research@medgenome.com


#Single Cell Research, #tSNE plots, #Gene Expression, #RNA sequencing, #Bioinformatics Solutions, #Bioinformatics Reports


Single Cell Sequencing New Insights

The advent of single cell sequencing technologies has enabled us to understand and study the complexities of biological systems at a finer resolution. Traditional bulk sequencing methods provide an average representation of gene expression across a population of cells, masking the inherent heterogeneity that exists within a tissue or organism. However, single cell sequencing allows us to capture the maximal transcript diversity in a given cell and allows for a multi-model analysis strategy to generate meaningful insights.

By MedGenome Scientific Affairs

The advent of single cell sequencing technologies has enabled us to understand and study the complexities of biological systems at a finer resolution. Traditional bulk sequencing methods provide an average representation of gene expression across a population of cells, masking the inherent heterogeneity that exists within a tissue or organism. However, single cell sequencing allows us to capture the maximal transcript diversity in a given cell and allows for a multi-model analysis strategy to generate meaningful insights.

Single Cell Technologies

In recent years, technological advancements have improved the efficiency, throughput, and accuracy of single cell sequencing methods.

To achieve single cell resolution, various technologies have been developed, each with its own strengths and limitations. One commonly used approach is droplet-based sequencing, which encapsulates individual cells into tiny droplets along with a unique barcode. This barcode allows for the identification and quantification of transcripts originating from each cell. Droplet-based technologies have the advantage of high throughput, enabling the profiling of thousands to millions of cells in a single experiment. However, they may suffer from certain technical constraints, such as limited sensitivity and the inability to capture full-length transcripts.

Another approach is plate-based sequencing, where single cells are sorted into individual wells of a microplate. This method allows for more precise control over cell capture and is particularly useful when studying rare cell populations. Plate-based technologies also enable the isolation of intact cells for downstream functional assays, such as cell culture or transplantation experiments. However, they are generally lower throughput and require more extensive manual handling.

Regardless of the specific technology used, scRNA-seq data analysis is a critical step in extracting meaningful insights from the vast amount of information generated. Computational methods have been developed to handle the unique challenges posed by single cell data, such as high dimensionality, sparsity, and batch effects. These tools allow researchers to identify differentially expressed genes, perform clustering and trajectory analysis, and visualize the resulting data in a biologically interpretable manner.

Here we explore three broader areas of single cell research that helps us to discover novel insights:

Single Cell RNA Sequencing

One of the key advantages of scRNA-seq is its ability to capture the transcriptomes of individual cells, allowing for the identification of cell types, subpopulations, and rare cell states that may have been overlooked in bulk analyses. By profiling the gene expression patterns of thousands or even millions of single cells, researchers can gain unprecedented insight into the dynamic nature of cellular heterogeneity and its impact on development, disease progression, and therapeutic response.

Moreover, scRNA-seq has shed light on the existence of transitional cell states that occur during cellular differentiation processes. By capturing the gene expression profiles of cells at different time points, researchers can construct lineage trajectories and decipher the molecular events that drive cell fate decisions. This newfound knowledge has the potential to transform regenerative medicine, as it provides a blueprint for generating specific cell types in the laboratory for transplantation or disease modeling purposes. This has led to significant progress in various fields, such as cancer research, immunology, neuroscience, and developmental biology.

Single Cell Immuneprofiling

In recent years, single cell sequencing has also made significant contributions to the field of immunology. By profiling the transcriptomes of individual immune cells, researchers can gain a deeper understanding of the complex interactions between different cell types and their roles in immune responses. This approach, known as single cell immuneprofiling, has the potential to revolutionize the development of immunotherapies and personalized medicine.

For example, scRNA-seq has revealed the existence of rare subsets of immune cells that have distinct functional properties and play crucial roles in disease pathogenesis. By characterizing these rare cell types, researchers can identify novel therapeutic targets and develop more effective treatments. Additionally, single cell immuneprofiling has shed light on the mechanisms underlying immune evasion in cancer and autoimmune diseases, providing new avenues for therapeutic intervention.Furthermore, scRNA-seq has enabled the study of immune cell dynamics in response to infection or vaccination. By capturing the gene expression profiles of immune cells at different time points, researchers can decipher the molecular events that drive immune activation and memory formation. This knowledge can inform the development of vaccines and adjuvants that elicit robust and long-lasting immune responses.

Single Cell Epigenetics

In addition to gene expression analysis, single cell sequencing has also opened the door to studying the epigenetic landscape of individual cells. Epigenetic modifications, such as DNA methylation and histone modifications, play a crucial role in regulating gene expression and cellular identity. Traditional bulk sequencing methods provide an average measurement of these modifications, masking the cell-to-cell variability that exists within a population. However, with single cell epigenetics, researchers can now explore the dynamics of epigenetic regulation at a single cell resolution.

Single cell DNA methylation sequencing allows for the identification of cell-specific DNA methylation patterns, providing insights into cell lineage relationships and developmental processes. By comparing the methylomes of different cell types, researchers can unravel the epigenetic mechanisms that drive cell fate decisions and contribute to disease states.

Furthermore, single cell chromatin accessibility assays have enabled the characterization of cell-type-specific regulatory elements and the identification of transcription factor binding sites, shedding light on the transcriptional regulatory networks that underlie cellular diversity.

Novel techniques, such as spatial transcriptomics and multiomics approaches, are also being used to further enhance, gain holistic understanding of gene and protein expression in the tissue microenvironment. This opens the way to high resolution spatial analysis of cells and tissues without introducing biases in cell recovery.

Overall, single cell sequencing has provided a powerful toolkit for dissecting the complexities of biological systems at an unprecedented level of resolution. By profiling the transcriptomes, immune repertoires, and epigenomes of individual cells, researchers have gained new insights into the mechanisms that govern development, disease, and therapeutic response. As single cell technologies continue to evolve and improve, we can expect even greater discoveries and advancements in the field of genomics and beyond. Therefore, it’s important to stay updated with the latest developments and breakthoroughs gained through single cell sequencing.

MedGenome’s Powerful Single Cell Bioinformatics Analysis Pipeline

To support the single cell research, MedGenome has created highly specific single cell advanced analysis pipelines for different data modalities. Our pipelines can analyze all of 10X Genomics data outputs using well adopted tools in the industry. Our PhD level team can perform sample integration and comparisons, customized analysis, integration of ad hoc tools, project specific visualizations and final customized reporting to support your scientific publications.

  • • Single 3’ and 5’ Gene Expression
  • • Single Cell Multiome: ATAC + Gene Expression
  • • CITE-seq: Cell surface protein expression + Gene Expression
  • • Single cell immune profiling: VDJ expression for paired B-cell or T-cell receptors (possible coupling with GEX data)
  • • Visium spatial transcriptomics: GEX analysis on sectioned tissue layer

#Single Cell Sequencing, #Single Cell Technologies, #Single Cell RNA Sequencing, #scRNA-seq, #Single Cell Immuneprofiling, #Single Cell Epigenetics, #Single Cell Analysis


Introduction to Single Cell Sequencing – Cite-Seq – Series 3

Cite-Seq, short for Cellular Indexing of Transcriptomes and Epitopes by sequencing, is a powerful technology that has revolutionized single-cell sequencing. With its ability to analyze transcriptomes and protein expression at a single-cell level, Cite-Seq has the potential to greatly advance our understanding of cellular heterogeneity and function in biological systems. In this article, we will discuss the workings of Cite-Seq, its current and potential applications in various fields of research, and its limitations.

By Derek Vargas and Dr. Anantha Kethireddy , Scientific Affairs, MedGenome Inc

Cite-Seq, short for Cellular Indexing of Transcriptomes and Epitopes by sequencing, is a powerful technology that has revolutionized single-cell sequencing. With its ability to analyze transcriptomes and protein expression at a single-cell level, Cite-Seq has the potential to greatly advance our understanding of cellular heterogeneity and function in biological systems. In this article, we will discuss the workings of Cite-Seq, its current and potential applications in various fields of research, and its limitations.

How Cite-Seq Works?

Cite-Seq is a technique that combines single-cell RNA sequencing (scRNA-seq) with antibody-based surface protein detection. The goal is to analyze the transcriptome of each individual cell, along with the surface proteins that are expressed on the cell membrane. By doing so, researchers can get a better understanding of the diversity and functionality of individual cells in a population. The Cite-Seq workflow involves several key steps:

  • 1. Surface Protein Staining with Antibody-oligonucleotide Conjugates:
    The first step is to dissociate the tissue into a single cell suspension. Next, the cells are stained with a panel of antibodies targeting specific surface proteins of interest. Each antibody is conjugated to a unique oligonucleotide barcode, which allows for the identification of the protein that is bound to each cell. The cells are then sorted based on the presence or absence of each surface protein, and the RNA and protein are isolated from each individual cell.
  • 2. Single Cell RNA Sequencing & Cell surface protein detection:
    The next step is to generate gel bead in emulsion (GEM) with antibody labeled cells. Because the antibodies attached to the individual cell, they end up together in one GEM. This can be done using a droplet-based method developed by 10X Genomics. The cells are encapsulated in tiny droplets, along with a bead that contains a unique barcode. The reverse transcriptase then adds the barcode into the mRNA transcripts of the cell, allowing for its identification during downstream analysis. The cell barcodes are also added to the antibody-oligonucleotide conjugate.
  • 3. Sequencing and Data Analysis:
    The RNA and protein from each individual cell are then sequenced using standard techniques. The sequencing data is then analyzed using bioinformatic tools that allow for the identification of individual cells based on their gene expression and protein markers. By analyzing the transcriptomes and protein expression of individual cells, researchers can identify new cell types, characterize the heterogeneity of cell populations, and study the relationships between different cell types.
  • 4. Advantages of CITE-SEQ:
    Link a cell’s RNA profile with its surface proteins. Profiles multiple surface proteins simultaneously. Combines long standing knowledge of surface protein analysis with ever more complete RNA -Seq data.


Applications of Cite-Seq in Biological Research

Cite-Seq has a wide range of applications in biological research. One of the most significant applications is in the identification of new cell types and the characterization of cellular heterogeneity. By analyzing the transcriptomes and protein expression of individual cells, researchers can identify rare or previously unknown cell types and explore the differences between cell populations. This has important implications for understanding disease states and developing new treatments.

For example, Cite-Seq has been used to identify new immune cell subsets and characterize their roles in the immune response. Researchers used Cite-Seq to investigate the heterogeneity of T cells in the lung tissue of mice infected with influenza virus. They identified a new subset of T cells that expressed a specific set of surface proteins and had a unique gene expression profile. This subset was found to be important for controlling viral replication and preventing lung tissue damage.

Cite-Seq has also been used to investigate the differentiation of stem cells into specific cell types. By analyzing the transcriptomes and protein expression of individual cells during the differentiation process, researchers can identify the genes and proteins that are important for cell fate determination. This has important implications for regenerative medicine and the development of cell-based therapies.

MedGenome offers end-to-end project support for Cite-Seq (TotalSeq A, B & C ) experiments. Our high-throughput lab can take fresh tissue samples, dissociate them into single-cell suspensions, then stain with oligonucleotide-conjugated antibodies (we recommend Biolegend’s universal cocktail for maximum coverage). We generate scRNA-Seq libraries using the 10X Genomics platform.

Our bioinformatics team is specialized in providing cutting-edge analysis of single-cell or single-cell sequencing data, using the latest technology and techniques to help you gain deep insights into your biological samples. Whether you are working in genomics, transcriptomics, or other fields, our team of expert analysts can help you interpret your data with precision and efficiency. We use advanced algorithms and machine learning techniques to analyze your data and provide customized reports that meet your unique needs. With our comprehensive approach to single-cell sequencing data analysis, you can be sure that you are getting the most accurate and reliable results possible.


#Cite-Seq, #for Cite-Seq experiments, #scRNA-Seq libraries, #Surface Protein Staining, #Antibody-oligonucleotide Conjugates, #single-cell data analysis